7 Multimodal integrated system
7.1 First-last mile solutions
Updated: 13th July 2022
Definition
The ever-increasing demand for freight and passenger transport in recent years has exacerbated the negative impacts of mobility (congestion, traffic accidents, air pollution, noise and climate change costs). Urban settlements are particularly affected due to higher population density. The term “first-last mile” (FLM) refers to the first and last stages of any transport movement, both passenger and freight which have the most negative effects and highest costs. However, from a planning perspective, the simple identification of the FLM is not easy, as it is not easy to understand where the FLM physically begins and where it ends. The FLM problem originated in the field of telecommunications, defined as the first-last stage to the consumer. In the 1970s and 1980s, cable TV companies had to connect and wire each household individually when the technology was introduced in North America and Europe (Nocera et al., 2020).
In the transport literature, there are different definitions for such a construct. Arvidsson et al. (2016) defines the FLM in the context of freight transport as the first-last part of the transport chain where goods are transported from a professional party to the customer’s location, be it a house, a retail shop, a drop-off point or a factory. In the context of passenger transport, it is defined as the first-last stage of a journey by public transport and often the journey from home to a transport hub or vice versa.
In the context of passenger transport, air quality and traffic congestion have been the catalysts for new thinking in urban design. Terms like “liveable”, ” pedestrianisation” and “green streets” represent the transformation that many European cities are undergoing. Some of the measures being taken are investments in cycling infrastructure, more pedestrian zones, new green spaces and street furniture, and restrictions on the use of private vehicles. Many cities are formalising their plans for more sustainable urban transport systems - as shown by the number of cities across Europe implementing a Sustainable Urban Mobility Plan (SUMP). The City Database | Eltis (2021) now contains details of over 1,000 cities involved in ongoing or completed urban mobility projects and initiatives. Micromobility has emerged as a possible solution to some of the problems cities face. It is a mode of transport advocated by the younger generation, who have different travel habits than older generations (Twisse, 2020).
These new FLM solutions also aim to help improve accessibility to public transport. As public transport is an affordable and sustainable mobility option, improving it through a wide range of transport-based options helps to promote a more equitable society. People who lack mobility to reach places such as jobs, education and childcare are at a transport disadvantage. Access to public transport at both ends of a transit trip has been identified as one of the biggest barriers to improving accessibility to public transport. Minimising the deficit at the first and last mile can make communities more inclusive by increasing the supply of accessible options (Zuo et al., 2020a). The speed advantage of cycling over walking can mitigate the first and last mile problem and provides better point-to-point transit mobility (Zuo et al., 2018). However, heavy car traffic and consequently high congestion make roads less attractive and unsuitable for cyclists (Winters et al., 2011) and lead to fragmented cycling routes (Furth et al., 2016). Meanwhile, the poorly connected cycling network makes cycling less accessible and hinders the accessibility of cycling as a mode of transport (Zuo et al., 2020a).
Traditional F/L/O mile options are walking and cycling. However, with the development of new technologies, new F/L/O-mile options for personal transport have become available and they are becoming more convenient to use. The new technologies also allow a better integration of different transport modes and tariffs. The merging of different means of transport into a service that meets the mobility needs of individual customers is now an established business model called Mobility-as-a-Service (EEA, 2019).
Micromobility is the term used to describe the new, exponentially growing trend in urban mobility to improve F/L/O options. The term includes all human-powered micro-vehicles such as bicycles and scooters, but also new micro-vehicles such as e-scooters, e-bikes and some other small, electrically powered vehicles (Oeschger et al., 2020). In the ITF report “Safe Micromobility” (OECD/ITF, 2020), micromobility is defined as: “[…] the use of micro-vehicles: vehicles with a mass of no more than 350 kg (771 lb) and a design speed no higher than 45 km/h. This definition limits the vehicle’s kinetic energy to 27 kJ, which is one hundred times less than the kinetic energy reached by a compact car at top speed.”
The ITF report differentiates between several different micromobility alternatives (OECD/ITF, 2020):
- Powered two-wheeler
- Motorcycle (Powered street vehicle, with two to three wheels and a seat, designed to reach speeds greater than 45 km/h.)
- Moped (Powered road vehicle, with two to three wheels and a seat, sometimes equipped with pedals. The maximum speed of the vehicle depends on national regulations, but is usually limited to 45 km/h.)
- Bicycle
- Bicycle (A vehicle with two or more wheels that is generally propelled by the muscular power of the persons on that vehicle, through a pedal system, lever or handle.)
- Pedal assisted bicycle or E-Bike (Pedelec <25 km/h, Speed-pedelec >25 km/h)
- Mobility scooter (specifically designed for people with restricted mobility, mostly elderly or disabled)
- Scooter
- Standing scooter, Kick scooter or push scooter (A vehicle with a handlebar, deck and wheels that is propelled by pushing off the ground. There are models with two, three or four wheels. Stand-up scooters differ from skateboards in the presence of a central steering column and a set of handlebars.)
- E-scooter and standing or with a seat (A standing or sitting scooter that can be propelled by the electric motor itself.)
- Skateboard
- Skateboard (Board with four wheels on two axles, propelled by the user kicking against the ground.)
- Electric skateboard (Skateboard with electric battery, motor, and wireless remote controller.)
- Self-balancing
- Hoverboard (Self-balancing micro-vehicle consisting of two motorised wheels connected to a pair of articulated pads on which the rider places his feet. The rider controls the speed by leaning forward or backward and the direction of travel by twisting the pads.)
- Onewheel (Self-balancing electric wheel with a platform on which the user stands. The feet are at a 90° angle to the direction of travel.)
- Electric unicycle (Self-balancing, single-axle, personal transport device operated with the feet in the direction of travel with a single wheel or with two wheels. The rider controls the speed by leaning forward or backward and steers by turning the device with the feet).
- Electric skates (Skates with electric battery and motor, controlled by the user leaning forward or backward or using a remote controller.)
- Skates (Pair of boots with a set of wheels fixed to the bottom.)
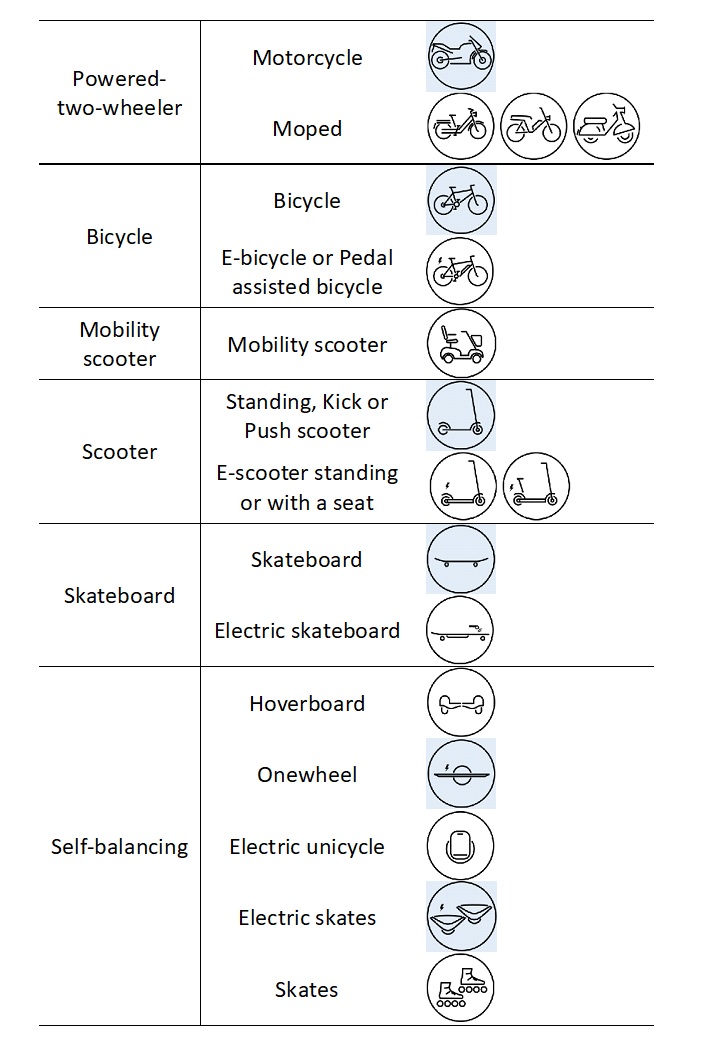
Figure 7.1: Micromobility (adapted from OECD/ITF (2020)).
Definitions, classifications and regulatory frameworks for micromobility vary around the world. Bicycles are the smallest vehicle in most countries’ classifications. Consequently, a number of micro-vehicles - such as standing e-scooters, e-skateboards and self-balancing vehicles - are excluded from classifications. In some cases, they are classified as toys and are therefore not allowed on public roads. As a temporary solution, Korea has classified these devices as cars. The authorities in Singapore decided to create a new vehicle category called “Personal Mobility Device” (PMD). Given the obvious international importance of micro-vehicles and the difficulty in defining and categorising them, it might be useful to develop an internationally recognised classification system for them (OECD/ITF, 2020).
In the European Union Regulation No. 168/2013, micromobility vehicles are in class L (UNECE, 2017). Class L vehicles are motorised two-, three- and four-wheeled vehicles. The category uses power, energy source, speed, length, width and height as classification criteria. However, only “powered electric bicycles with a maximum speed of 25 km/h and a net power of between 250 watts and 1 000 watts” and “any two-wheeled vehicle with a maximum design speed of more than 25 km/h and up to 45 km/h and a net power of up to 4 000 watts” can be classified in the L1e category of “light two-wheeled motor vehicles”. Other micro-vehicles do not fit into any category. OECD/ITF (2020) proposes to classify micromobility as follows:
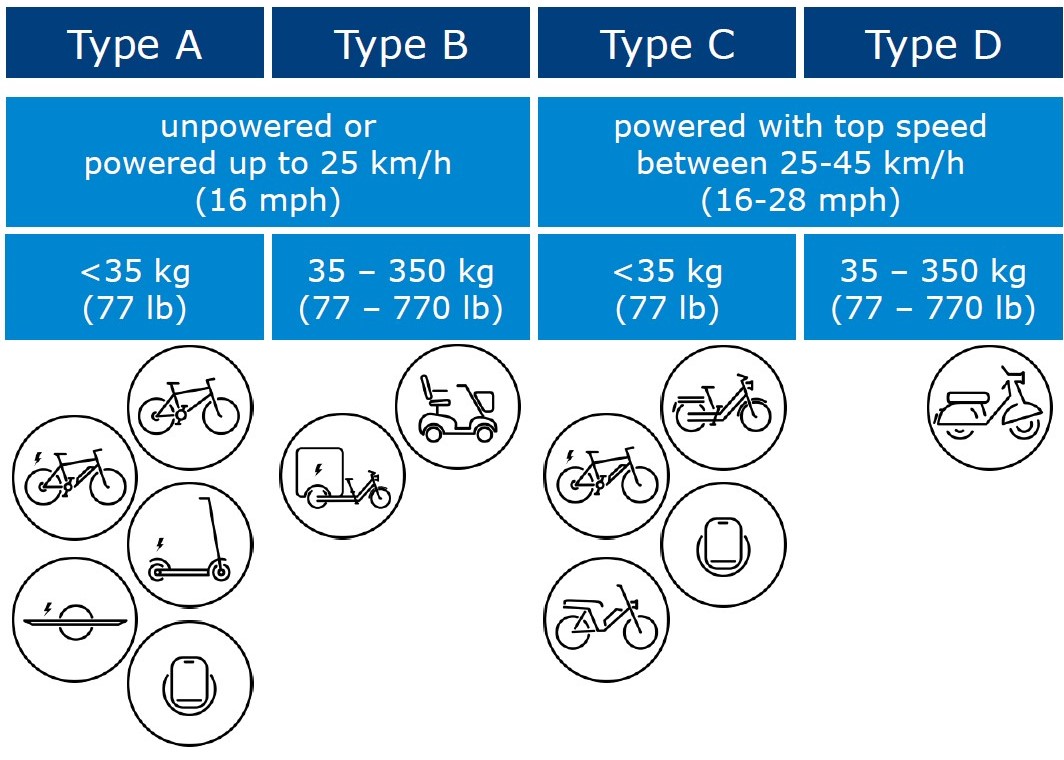
Figure 7.2: Proposed classification of micro-mobility devices (OECD/ITF (2020).
In terms of freight transport, intermodal freight transport is crucial as a feeder to cities to reduce emissions. In the city centre (see urban deliveries) there are two main areas that could provide practical and relevant solutions to address the challenges and efficiency of last mile freight transport: (1) freight demand management (FDM) measures and (2) improving parking and charging infrastructure. One FDM measure would be to push for out-of-hours deliveries in order to change the delivery activities of freight forwarders and shippers. Furthermore, receiver prices as well as incentives could play an important role in reducing freight transport. (Holguín-Veras & Sánchez-Díaz, 2016). In European cities (especially in France), a significant proportion of double-parked delivery vehicles (delivery vehicles parked on the street parallel to parked cars) is observed (Patier et al., 2014). In this context, Smart delivery space booking could reduce the effects. Passenger drones and Electric vehicle delivery fleets could also reduce some of the externalities of freight transport in cities, but they might also create some new negative externalities.
Key stakeholders
- Affected: All citizens
- Responsible: Transport service providers and public transport operators, MaaS operators and integrators, city councils, local, regional and national authorities
Current state of art in research
EEA (2019) concludes that better F/L/O-mile connectivity in cities can significantly improve environmental and health outcomes. Similar outcome was found in a literature review by Abduljabbar et al. (2021) for micro-mobility solutions, which showed that micro-mobility solutions help to address a number of transportations challenges like alleviating congestion, addressing inequality and reducing emission. However, realising this potential requires a deep understanding of the different options, their strengths and weaknesses and their impacts on the mobility system as a whole. This is not always easy, as the environmental and health impacts of F/L/O mileage options depend on how they are used and what they replace. This highlights the fact that the increasing availability of e-scooters and digital ride-sharing platforms is changing mobility behaviour in cities, but does not always favour the more climate-friendly choice. A simple example would be a short trip with an e-scooter. If this trip replaces a motorbike or car ride, the environmental and health effects are positive. If it replaces a trip on foot or by bicycle, the situation worsens. More transport options can also lead to people making additional or longer trips, which in turn could worsen the situation. Furthermore, public transport will remain an essential part of any sustainable urban transport system. Good F/L/O-mile options can make public transport more attractive and increase its use, but not replace it completely (EEA, 2019). Laa & Leth (2020) also notes that e-scooter trips mostly replace trips that would otherwise have been made by a more sustainable mode of transport.
In terms of Environmental sustainability Severengiz et al. (2020) compares the g CO2 eq/passenger km (pkm) of different modes of transport (Figure 7.3). Whereby Moreau et al. (2020) compared shared and private e-scooter and calculated 131g CO2 eq/pkm for the shared vehicle and 67g CO2 eq/pkm for the private vehicle.
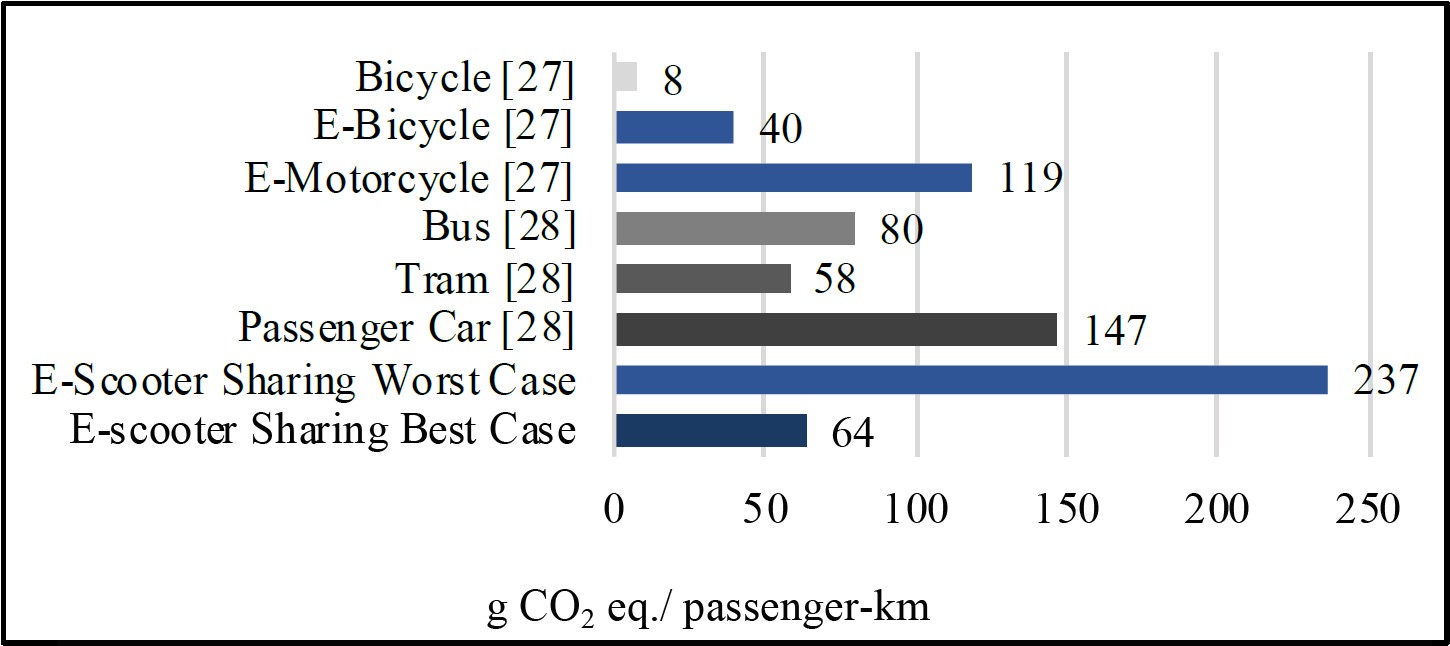
Figure 7.3: Comparison of the CO2 equivalent emissions per passenger-km of different modes of transport (Severengiz et al., 2020)
Accessibility is an indicator of the ability to reach frequently visited places efficiently. This is gaining increasing attention as a complement to the more traditional mobility-based performance measures in transport planning, such as ‘average delays’ and ‘level of service’. Assessing performance from an accessibility perspective provides a balanced, more holistic approach to transport analysis and planning. In particular, it considers alternative strategies to reduce congestion and mitigate environmental problems, such as promoting efficient, resource-efficient land use policies. Accessibility is a product of mobility and proximity, improved either by increasing the speed of getting between point A and point B (mobility), or by bringing points A and B closer together (proximity), or by a combination of these. In this sense, an accessibility-based approach lends legitimacy to land use initiatives and urban management tools (Cervero, 2005).
However, accessibility is defined differently in the literature. Shin et al. (2007) measured accessibility using proximity indices (distance and walking time to the nearest metro station). Martínez & Viegas (2009) defined accessibility by proximity to public transport nodes and the road network. In gravity-like measures, the accessibility of a zone is determined by the destinations that can be reached from that zone, negatively weighted by the travel time, distance or cost between these two zones (Grengs et al., 2010). In the isochronous approach, accessibility is measured as the number of destinations that can be reached within a given travel time (Cervero, 2005). Fan et al., 2012) examined the impact of introducing light rail on transport equity using the cumulative 30-minute accessibility of jobs by public transport. The first and last mile is an important component of a transit trip and determines whether the transit service is accessible or not. Cycling (or other FLM options) reduce transport inequality by increasing the catchment area of public transport so that people can reach more jobs by public transport (Zuo et al., 2020).
However, accessibility is defined differently in the literature. Shin et al. (2007) measured accessibility using proximity indices (distance and walking time to the nearest metro station). Martínez & Viegas (2009) defined accessibility by proximity to public transport nodes and the road network. In gravity-like measures, the accessibility of a zone is determined by the destinations that can be reached from that zone, negatively weighted by the travel time, distance or cost between these two zones (Grengs et al., 2010). In the isochronous approach, accessibility is measured as the number of destinations that can be reached within a given travel time (Cervero, 2005). Fan et al. (2012) examined the impact of introducing light rail on transport equity using the cumulative 30-minute accessibility of jobs by public transport. The first and last mile is an important component of a transit trip and determines whether the transit service is accessible or not. Cycling (or other FLM options) reduce transport inequality by increasing the catchment area of public transport so that people can reach more jobs by public transport (Zuo et al., 2020).
EEA (2019) summarises the lessons learned for systemic change through the use of First/Last/L only mileage options as follows:
- Make the impacts of mobility choices clear and offer alternatives
- Confront road users with the costs incurred by their mobility choices (internalise the external costs of each mode of transport)
- Offer sufficient and convenient alternatives
- Promote active transport as the first/last/only option for the mile
- Align technology with sustainable mobility goals
Bruzzone et al. (2021) and Nocera et al. (2020) explore the combination of passenger and freight flows with a focus on the last mile. Such a model is an integrated system in which passengers and goods share vehicles, infrastructure, urban space or more than one of these simultaneously. For example, Fatnassi et al. (2015) show the potential sustainability gains of sharing goods and passengers in a network with a focus on improving service time and energy waste.
In terms of safety OECD/ITF 2020 find out that a trip by car or motorbike in a dense urban area is much more likely to cause fatalities of road users than a trip by a type A micro vehicle. A modal shift from motor vehicles to Type A micro-vehicles can, therefore, make a city safer. A shift from pedestrians to Type A micro-vehicles would have the opposite effect. The safety of e-scooters is likely to improve over the next few years as the users learn to navigate urban traffic and car drivers and pedestrians get used to the new forms of mobility. Safety will also improve as governments introduce safe cycling infrastructure and targeted safety regulations for micro-vehicles and shared mobility services. There are significant regulatory challenges due to the rapid pace of innovation in micro-vehicle development. They suggest the following measures to improve the safety of micro-mobility:
- Provide protected space for micro-mobility and keep pedestrians safe (Where pedestrians do not feel safe on pavements, the number of people walking will decrease).
- Low speeds of e-scooters and e-bikes should be regulated as bicycles, higher speeds of micro-mobiles as mopeds
- Collect data on micro-vehicle trips and accidents (in order to pro-actively manage the safety performance of road networks)
- Incorporate micro-mobility into road user education
- Combat drunk driving and speeding for all types of vehicles
- Remove incentives for micro-mobile drivers to speed (Minute-by-minute rental can be an incentive to speed or ignore traffic rules. Alternatives include a fixed driving fee, a distance-based fee or a membership fee).
- Improve micro-vehicle design (Micro-vehicle manufacturers should try to improve stability and road grip. Solutions could be found in pneumatic tyres, larger wheels and frame geometry, but also in areas that still need to be explored).
- Reduce general risks associated with micro-mobility sharing (minimise vehicle kilometres driven by escort vehicles for moving or charging micro-mobility devices, use removable or higher capacity batteries and plug-in docks, allocate space for on-street parking of micro-vehicles).
Reck et al. (2022) found that shared e-scooters and e-bikes emit more CO2 than the transport modes they replace. In contrast, private/personal e-scooters and e-bikes emit less than the transport modes they replace. This finding might be important for planners to test the effectiveness of policy interventions through transport simulations when it comes to micro-mobility and it’s variety of vehicle types.
Current state of art in practice
A new coalition, Micro-mobility for Europe (MMfE), has come together in Europe in 2021. Eight e-scooter operators (Bird, Bolt, Dott, FreeNow, Lime, TIER, Voi and Wind) want to contribute to the development of a coherent policy framework in Europe through this coalition (Intelligent Transport, 2021).
Research and Markets (2021) names bike sharing, kick scooter sharing and scooter sharing as the dominant micro-mobility sharing modes. By 2020, the global fleet was around 20.5 million vehicles and the market value was at $44.12 billion while it is projected to reach $214.57 by 2030 (Yadav et al, 2022). Globally, bike sharing is currently estimated to account for almost 98% of the fleet size of the micro-mobility market. The most important factor cited is the advancement of technologies. Innovations mentioned are infrastructure solutions (e.g. smart docking stations, solar-powered charging stations and mobility hubs), hardware solutions (e.g. smart locks and sensors) and high-end software solutions (e.g. mapping and navigation, fleet security, real-time fleet data and analytics, and smart fleet management), driven by AI engines and IoT sensors. Micro-mobility business models such as public-private partnerships, private bike-sharing schemes and non-profit programmes are evolving and micro-mobility systems continue to be embedded in municipal transport and become an integral part of the emerging Mobility-as-a-Service (MaaS) ecosystem.
In 2018, the first full year after the launch of e-scooter sharing, Americans have already taken 38.5 million trips on shared e-scooters (compared to station-based bike sharing with 36.5 million trips, which has been on the market for almost ten years). Electrically powered micro-mobility is projected as the most lucrative in the propulsion type segment, while bicycles are the most profitable when it comes to vehicle types. However, existing demand for other micro-mobility are not predicted to decrease (Yadav et al., 2022). Which indicates that it makes sense to support different models/vehicles. Considering the high demand and rapid adoption of micro-mobility options, the expected global market potential is over $500 billion by 2030 (Eliasen, 2021). In comparison, the micro-mobility market in Europe is estimated to be worth over 100 billion euros in 2030 (Twisse, 2020).
Most new micro-mobility platform start-ups (mainly e-scooters) were initially unprofitable because the operational costs of running e-scooters (charging, repair/maintenance, insurance and payment fees) were so high that the payback period for the initial scooter purchase was shorter than the lifetime of the scooter, resulting in a negative return on investment per scooter. According to Travis VanderZanden, CEO of Bird, the profitability of the units has improved significantly in recent years due to improvements in the durability of the scooters and price increases for customers (Eliasen, 2021). Reck et al. (2021) looked at the use of shared micro-mobility in Zurich and found that the adoption rate of e-scooters is the highest (28%), compared to docked (e-) bikes (16%) and dockless (e-) bikes (9%), although e-scooter ownership is uncommon (3%) compared to e-bike ownership (14%). Additionally they found, that micro-mobility users tend to be young, well-educated, affluent males and shared e-scooter users are the most representative of the larger population.
Haas (2018) identifies four challenges that need to be addressed to make FLM attractive:
Challenge 1: Accessibility
It happens quite often that no sharing transport can be offered in the vicinity. “On average, our customers are willing to walk 300 metres to a car.” says Olivier Reppert, (head of the car-sharing market leader Car2go). “If that doesn’t work several times, they jump off.” The company is, therefore , working hard to bring the vehicles as close as possible to the customers. “We know very precisely where which car should be at which time.” says Reppert. This can be determined precisely through anonymous data collection. But: “Today, we are not yet in a position to always target exactly these points.” Reppert has high expectations for the future use of autonomous vehicles that move themselves to carsharing hotspots: “Then we would only need 50 per cent of the current fleet to serve the same demand.” he says.
Challenge two: The combination
To enable the perfect combination of the different offers, an app is needed that includes all options and coordinates them with each other. So far, there are only a few such apps with as many means of transport as possible in the cities. This could improve if the cities, which should have the best overview of the available means in their area, take the lead themselves.
Challenge three: The legal situation
“If various small vehicles simply share the footpaths, cycle paths or roads, this will lead to more accidents” says Markus Friedrich (professor of traffic planning and traffic control technology at the University of Stuttgart). However, there is not enough space to offer a separate lane for each type. He, therefore, sees the solution in a change to the current speed limits in the road traffic regulations: “With a standard speed of 30km/h, vehicles can share the road space better.” says the professor. “And as soon as many vehicles have electric drives, a limit of 20km/h is conceivable in the current 30km/h speed zones.” On main urban roads, higher speeds could still be allowed.
Challenge four: The public transport upgrade
The numerous additional services could not only complement but replace bus and rail. Demand could increase significantly if the advantages of the gained efficiency unfold - from higher availability to cheaper prices. Therefore, public transport must be made faster so that it offers a travel time advantage. What is needed, Friedrich says, are express buses and express trains that are given their own routes and do not stop as often as before. Many cities would need a much denser frequency or additional express trains.
Relevant initiatives in Austria
Passenger FLM
- E-scooters
- Bicycle and E-Bicycle hire
- Car sharing
- Ride-hailing & Ride-sharing
- Mobility-as-a-Service
- Passenger drones
- Demand responsive transit
- Mobility hubs
Freight FLM
- Urban Deliveries
- Smart delivery space booking
- Delivery drones
- Freight hubs
See also shared mobility section.
Impacts with respect to Sustainable Development Goals (SDGs)
| Impact level | Indicator | Impact direction | Goal description and number | Source |
|---|---|---|---|---|
| Systemic | Reduction in transit service inequality | + | Equality (5,10) | Zuo et al., 2020a |
| Systemic | Reduction in negative externalities but substitution of more environmentally friendly modes e.g. walking | ~ | Environmental sustainability (7,12,13,15) | Twisse, 2020 |
| Systemic | Profits from growth in micromobility sector (F/L/O options) | + | Sustainable economic development (8,11) | Goessling, 2020 |
| Systemic | Improvement in technology of micro-mobility equipment | + | Innovation & Infrastructure (9) | Eliasen, 2021 |
References
- Abduljabbar, R. L., Liyanage, S., Dia, H. (2021). The role of mirco-mobility in shaping sustainable cities: A systematic literature review. Transportation Research Part D. 92, 102734. https://doi.org/10.1016/j.trd.2021.102734
- Arvidsson, N., Givoni, M., & Woxenius, J. (2016). Exploring last mile synergies in passenger and freight transport. Built Environment, 42(4), 523–538. https://doi.org/10.2148/benv.42.4.523
- Bruzzone, F., Cavallaro, F., & Nocera, S. (2021). The integration of passenger and freight transport for first-last mile operations. Transport Policy, 100, 31–48. https://doi.org/10.1016/j.tranpol.2020.10.009
- Cervero, R. (2005). Accessible Cities and Regions: A Framework for Sustainable Transport and Urbanism in the 21st Century. https://doi.org/10.11436/mssj.15.250
- City database | Eltis. (2021, July 19). https://www.eltis.org/mobility-plans/city-database
- EEA, E. E. A. (2019). The first and last mile — the key to sustainable urban transport (Issue 18).
- Eliasen, J. (2021, January 15). The Future of Micromobility. How VCs and E-Scooters kicked off the… | by Jason Eliasen | The Startup | Medium. https://medium.com/swlh/the-future-of-micromobility-2d4d96d4e2dd
- Fan, Y., Guthrie, A., & Levinson, D. (2012). Impact of light-rail implementation on labor market accessibility. Journal of Transport and Land Use, 5(3), 28–39.
- Fatnassi, E., Chaouachi, J., & Klibi, W. (2015). Planning and operating a shared goods and passengers on-demand rapid transit system for sustainable city-logistics. Transportation Research Part B: Methodological, 81, 440–460. https://doi.org/10.1016/j.trb.2015.07.016
- Furth, P. G., Mekuria, M. C., & Nixon, H. (2016). Network Connectivity for Low-Stress Bicycling. Transportation Research Record, 2587(1), 41–49. https://doi.org/10.3141/2587-06
- Gössling, S. (2020). Integrating e-scooters in urban transportation: Problems, policies, and the prospect of system change. Transportation Research Part D: Transport and Environment, 79(January), 102230. https://doi.org/10.1016/j.trd.2020.102230
- Grengs, J., Levine, J., Shen, Q., & Shen, Q. (2010). Intermetropolitan Comparison of Transportation Accessibility: Sorting Out Mobility and Proximity in San Francisco and Washington, D.C. Journal of Planning Education and Research, 29(4), 427–443. https://doi.org/10.1177/0739456X10363278
- Haas, C. (2018, November 13). Nahverkehr: So lässt sich die letzte Meile nach Hause bequem zurücklegen - WELT. https://www.welt.de/wirtschaft/article183688842/Nahverkehr-So-laesst-sich-die-letzte-Meile-nach-Hause-bequem-zuruecklegen.html
- Holguín-Veras, J., & Sánchez-Díaz, I. (2016). Freight Demand Management and the Potential of Receiver-Led Consolidation programs. Transportation Research Part A: Policy and Practice, 84, 109–130. https://doi.org/10.1016/j.tra.2015.06.013
- Intelligent Transport. (2021, February 2). Big names across micromobility sector form European coalition. https://www.intelligenttransport.com/transport-news/116405/micromobility-for-europe/
- Laa, B., & Leth, U. (2020). Survey of E-scooter users in Vienna: Who they are and how they ride. Journal of Transport Geography, 89(October), 102874. https://doi.org/10.1016/j.jtrangeo.2020.102874
- Martínez, L. M., & Viegas, J. M. (2009). Effects of Transportation Accessibility on Residential Property Values: Hedonic Price Model in the Lisbon, Portugal, Metropolitan Area. Transportation Research Record, 2115(1), 127–137. https://doi.org/10.3141/2115-16
- Moreau, H., de Meux, L. J., Zeller, V., D’Ans, P., Ruwet, C., & Achten, W. M. J. (2020). Dockless e-scooter: A green solution for mobility? Comparative case study between dockless e-scooters, displaced transport, and personal e-scooters. Sustainability (Switzerland), 12(5). https://doi.org/10.3390/su12051803
- Nocera, S., Pungillo, G., & Bruzzone, F. (2020). How to evaluate and plan the freight-passengers first-last mile. Transport Policy. https://doi.org/10.1016/j.tranpol.2020.01.007
- OECD/ITF. (2020). Safe Micromobility. 98.
- Oeschger, G., Carroll, P., & Caulfield, B. (2020). Micromobility and public transport integration: The current state of knowledge. Transportation Research Part D: Transport and Environment, 89, 102628. https://doi.org/10.1016/j.trd.2020.102628
- Patier, D., David, B., Chalon, R., & Deslandres, V. (2014). A New Concept for Urban Logistics Delivery Area Booking. Procedia - Social and Behavioral Sciences, 125, 99–110. https://doi.org/10.1016/j.sbspro.2014.01.1459
- Reck, D. J., Axhausen, K.W. (2021). Who uses shared micro-mobility services? Empirical evidence from Zurich, Switzerland. Transportation Research Part D: Transportation and Environment. 94, 102803. https://doi.org/10.1016/j.trd.2021.102803
- Reck, D. J., Martin, H., Ayhausen, K. W. (2022). Mode choice, substitution patterns and environmental impacts of shared and personal micro-mobility. Transportation Research Part D. 102, 103134.
- Research and Markets. (2021, June 15). Global Micromobility (Bikes, Scooters, Kick-scooters) Markets Report 2021-2025 - Future Growth Potential Enhanced by Opportunities Due to Government Push, Regulatory Reforms and Advancement in Technologies. https://www.prnewswire.com/news-releases/global-micromobility-bikes-scooters-kick-scooters-markets-report-2021-2025---future-growth-potential-enhanced-by-opportunities-due-to-government-push-regulatory-reforms-and-advancement-in-technologies-301312406.html
- Severengiz, S., Finke, S., Schelte, N., & Wendt, N. (2020). Life Cycle Assessment on the Mobility Service E-Scooter Sharing. 2020 IEEE European Technology and Engineering Management Summit, E-TEMS 2020, September. https://doi.org/10.1109/E-TEMS46250.2020.9111817
- Shin, K., Washington, S., & Choi, K. (2007). Effects of Transportation Accessibility on Residential Property Values: Application of Spatial Hedonic Price Model in Seoul, South Korea, Metropolitan Area. Transportation Research Record, 1994(1), 66–73. https://doi.org/10.3141/1994-09
- Twisse, F. (2020, August 12). The rise of micromobility | Eltis. https://www.eltis.org/resources/case-studies/rise-micromobility
- UNECE. (2017). ECE R78 - Consolidated Resolution on the Construction of Vehicles. United Nations Economic and Social Council, July. Available at: https://unece.org/resolutions (Accessed: 22/07/2021)
- Winters, M., Davidson, G., Kao, D., & Teschke, K. (2011). Motivators and deterrents of bicycling: Comparing influences on decisions to ride. Transportation, 38(1), 153–168. https://doi.org/10.1007/s11116-010-9284-y
- Yadav, P., Mutreja, S. (2022). Micromobility Market by Propulsion Type, Vehicle Type, Sharing Type and Age Group: Global Opportunity Analysis and Industry Forecast, 2021-2030. Available at: https://www.alliedmarketresearch.com/micro-mobility-market-A11372 [Accessed: 09th of July 2022]
- Zuo, T., Wei, H., Chen, N., & Zhang, C. (2020a). First-and-last mile solution via bicycling to improving transit accessibility and advancing transportation equity. Cities, 99, 102614. https://doi.org/10.1016/j.cities.2020.102614
- Zuo, T., Wei, H., & Rohne, A. (2018). Determining transit service coverage by non-motorized accessibility to transit: Case study of applying GPS data in Cincinnati metropolitan area. Journal of Transport Geography, 67, 1–11. https://doi.org/10.1016/j.jtrangeo.2018.01.002
7.2 Transit fares
Updated: 13th July 2022
Definition
Fares are fundamental element of transit operations, they have an important impact on ridership dynamics and the financial vitality of transit agencies (El-Geneidy et al., 2016; Zhao & Zhang, 2019). The way fares are set and subsequently adjusted is inherently complex. On the one hand, there is an attempt to ensure equity for the population and, on the other hand, to generate sufficient revenue for the transit agency (Brown, 2018; Yoh et al., 2016). In current transportation research, fares and especially fare structures (such as zone-based or distance-based fares) are argued to have negative effects on equity, although there is also evidence that it depends on where one lives and how this affects the degree of accessibility (Martens, 2012).
There is no universally accepted definition of equity in the context of public transport, but different ways of measuring equity from different perspectives, such as travel distance, time, comfort, and monetary costs. A necessary condition for the scientific measurement of equity in public transport is to focus on a specific dimension, such as monetary costs (fares) (Wang et al., 2021).
Three defining dimensions for assessing fairness can be identified in the literature on distributive justice (Rubensson et al., 2020):
- A normative dimension - the foundations of the fairness principle: e.g., should all outcomes be as similar as possible, or should all the people have as similar opportunities as possible, or should well-regulated markets be trusted to produce the fairest outcome?
- Authors choose what to measure - equity of inputs (fares, taxes), outputs (accessibility, geographic coverage), or consumption (trips made) of public transportation.
- Distributional differences - assessing horizontal equity (equity among members of the same group, such as all public transport users or all citizens) or vertical equity (equity among members of different groups, such as different income, age, or occupational groups).
A fare system typically contains four basic components (Streeting & Charles, 2006):
- Fare media - Paper tickets or smart cards
- Fare product - Range of available ticket types, such as frequency-based discounts and off-peak discounts, fare limitation to a fixed maximum amount on weekends (Chalabianlou et al., 2015; Guzman et al., 2014)
- Fare structure
- Fare level - Fares can be set at a flat rate or differentiated. Differentiation is usually proposed to achieve a fare system that lowers demand for trips with high production costs and increases demand for trips with low production costs, thus increasing revenues on the one hand and lowering prices for some users on the other (Rubensson et al., 2020).
The different fare structures are (Wang et al., 2021):
- Flat fares (a single fare for the entire fare system)
- Distance-based fares (fares calculated by distance)
A distanced-based system charges higher fares for passengers that cover longer distances. The fares are typically calculated on a route-by-route basis where it is based on the distance between origin and destination (OD). Distance-based fares are typically complicated to develop and enforce because they require a card to be swiped, tapped or punched for bus or rail, or they require a barrier that enforces additional payment. Furthermore, distance-based pricing is not frequently used in non-express routes and rail and it is more common for express routes and systems that radiate from a central area (McKone, 2010). - Time-based fares (fares calculated by travel time)
The time-based system allows passengers to use public transport and make free transfers in a set period of time. The validity period can be as short as 20 min (Krakow.pl, 2021) or an unlimited weekly, monthly or yearly pass (Wiener Linien, 2021). Importantly, this pricing system requires some sort of card (paper, magnetic or smart card) to issue the transfer. It is often used for within-city public transport solutions. - Zone-based fares (fares calculated by travel zone)
The fares are typically calculated based on the zones that establish increasing fares in certain regions of the city (e.g. in Paris commuter rail system or London Underground) (McKone, 2010).
Moreover, Brown (2018) mentions five types of fare structuring: flat, adjusted to distance travelled, variable by time of day, variable by mode, and/or discounted based on rider characteristics.
Key stakeholders
- Affected: Public Transport Passengers, Public Transport Operators
- Responsible: Local and National Governments, Transport Agencies authorities
Current state of art in research
The main issue currently being studied is equity under different fare systems (Brown, 2018; El-Geneidy et al., 2016; Rubensson et al., 2020; Wang et al., 2021; Zhao & Zhang, 2019).
Rubensson et al. (2020) find that in terms of horizontal equity (between public transport users and the public in general), distance fares offer the highest level of equality (0.04), followed by zone fares (0.07) and then flat fares (0.1) as measured by the Gini coefficient. However, in terms of vertical equity (across income groups), travellers from low-income areas pay a larger share of fares than higher-income travellers in all fare systems. They further conclude that as the distance-dependence of fares decreases, vertical equity increases and that an increasing distance-dependent fare system leads to increasing horizontal equity.
Brown (2018) concludes in a study of the effects of pricing on the equity in mass transit in Los Angeles that any type of fare variation improves equity compared to flat fares when the three criteria of equity (benefits received, ability to pay, and cost) are considered. In particular, a fare structure that includes both a per-mile fare and discounts for off-peak trips produces the most equitable results, as low-income passengers travel significantly shorter distances, ride more local buses, and make a smaller share of trips during peak hours. This also better reflects the marginal cost of providing the service. A slightly lower per-mile fare for low-income riders usually does not truly reflect the relative ability of those riders to pay if the fares are not cheap enough (e.g., LA Metro Rider Relief coupons to reduce the cost to riders by 10 percent (Los Angeles County Metropolitan Transportation Authority, 2021)). For example, if low-income riders are to be encouraged, households earning 50 percent of the area-wide median income should receive a 50 percent discount on the per-mile fare. This option is available in San Francisco right now (San Francisco Municipal Transportation Agency, 2021). Brown (2018) concludes that income-based discounts on flat fares would improve equity (as measured by the ability-to-pay criterion), but would likely not always reflect equity as measured by mileage or time-based cost variation. Instead, a distance-based and discounted off-peak fare structure is the best solution for all three equity criteria. Smart card technology has made the introduction and enforcement of variable fares much easier than in the past, and new transportation and financial innovations have made passengers more comfortable with variable fares on mass transit.
Wang et al. (2021) propose new fare equity evaluation measures using smart card data. These systems generate large volumes of transaction records from individual passenger trips and contain the information needed to map, measure, and monitor fare equity. In their study they conclude that adopting a more coarsely zoned structure, reducing variation in fare levels, and changing fare incentives will increase ridership, improve revenue, and offset fare disparities and improve fare equity across ridership types and urban area.
In 2022, free public transport is still researched in various aspects. The increase in overall public transport travel is one of the most appealing factors nowadays and is seen in all papers. Highest rates of growth is mostly observed with young and elderly people, while elderly people respond more strongly to discount measures than students. Still, existing literature states, that free-fare discounts are expensive policies with quite low efficiency (Tomes et al., 2022; Bull et al., 2021). Other looked at fare systems involving e-ticketing/smart ticketing to improve customer management, planning and convenience (Hojski et al. 2022) and is also discussed more in the next chapter (MaaS).
Current state of art in practice
According to Brown (2018) flat fares are the most common around the world and prevalent in the U.S., but these do not necessarily lead to equitable outcomes for passengers. Although equity is an important goal for most transit agencies, fare discussions are often influenced by budgetary concerns, rising operating costs, and aversion to public backlash. This creates a paradox between desired goals and current practices.
The prices of public transport for users vary greatly as a statistic of public transport single tickets worldwide shows (Figure 1). Also within a country the prices vary greatly as a report of the ADAC (2019) demonstrates. At 109.20 euros, the monthly ticket in Hamburg is almost twice as expensive as in Munich. However, in Hamburg you can still travel far beyond the city limits. The average monthly ticket in Germany costs 77.50 euros. Day tickets cost an average of 7.02 euros. In some cities it is valid for 24 hours from the time of validation and in others it is only valid for the day of validation, but often until well after midnight.
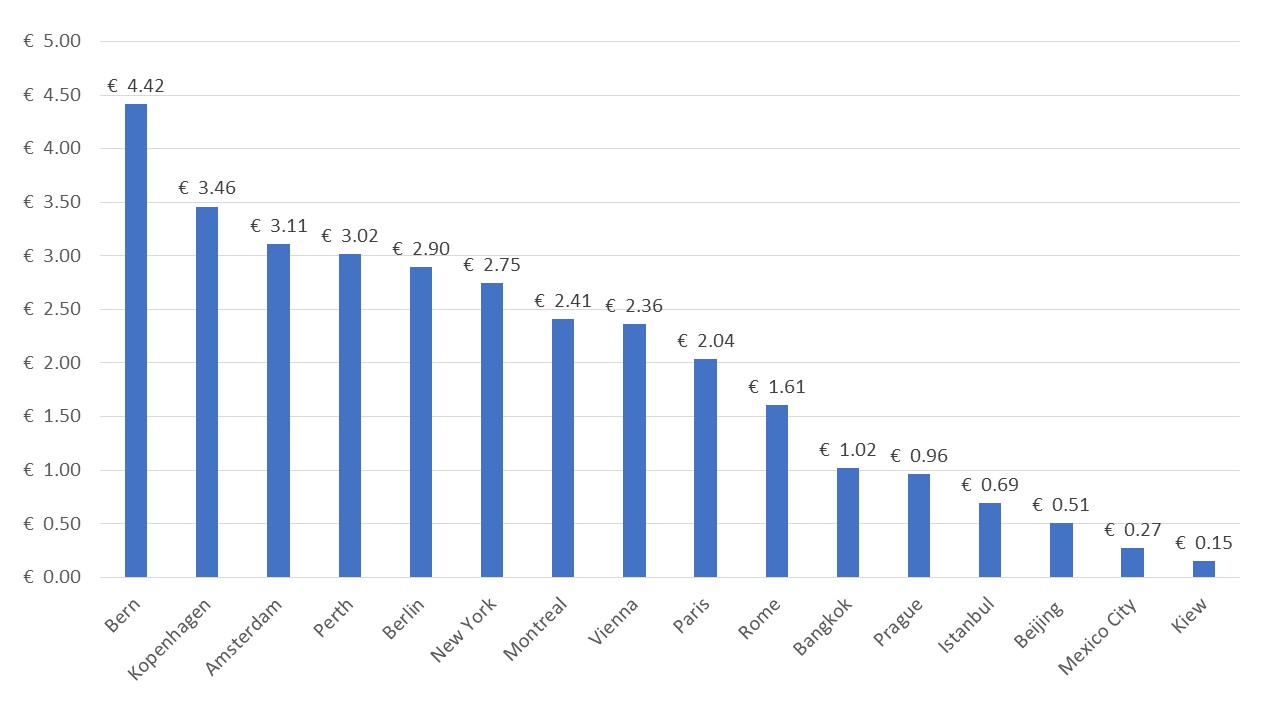
Figure 7.4: Prices for standard single tickets for local public transport in selected cities around the world (statista.at, 2017)
More and more cities nowadays offer public transport completely free of charge. The first experiments were already carried out in the 1960s. In the meantime, around 100 cities and towns around the world have introduced free public transportation in one way or another. In some cities, only part of the public network is free, and in others, certain groups of the population, such as registered residents or pensioners, are allowed to ride for free. In Tallinn, the capital of Estonia, for example, residents have been able to ride the public transport system without a ticket since 2013. According to a study, this led to an increase in the proportion of people using public transport in the city from 55 to 63 percent (Cats et al., 2017). In 2018, they expanded the model to other parts of the country. Luxembourg, with a population of 626,000, is the first country to offer completely free public transport since 2020 (Yeung, 2021). In Dunkirk, France, public transportation has been free since 2018. A government-commissioned study concluded that eight months after the model was introduced, trips by bus increased by 65 percent during the week and 125 percent on weekends. Now some larger French cities are also experimenting with the idea. In Paris, free public transport for under-18s was introduced in 2020. In Strasbourg, the same policy will be implemented in September 2021. According to the Strasbourg government, this is a climate protection measure, as many of the 80,000 or so schoolchildren are currently taken to school by their parents. It is also intended to help socially disadvantaged families (who will save around 550 euros a year with two children) (Pallinger, 2021). In the Occitanie region of southern France (population around six million), a scheme has been introduced whereby 18- to 26-year-olds who travel by train at least 30 times a month will pay nothing, with the dual aim of helping young workers and reducing carbon emissions (Yeung, 2021).
The criticism of free public transportation is, on the one hand, that it would then be financed by higher taxes. Audrey Pulvar, the deputy mayor of Paris, wants to balance the financing with higher taxes on emission-intensive cars and large corporations like Amazon. In any case, the costs arising from traffic accidents, air pollution and congestion can be saved. According to Pulvar, these sums up to ten billion euros each year in the Paris region (Pallinger, 2021). Pulvar’s proposals would first provide free transportation to youths under 18, students and job seekers in a phased rollout before expanding to all residents on weekends and then daily by 2026 (Yeung, 2021).
However, some people are sceptical about this idea. One of them is Kay Axhausen (professor for traffic planning at ETH Zurich). He argues that it can lead to an overload of the public transport and this leads to overcrowded and unreliable public transportation, and that customers are likely to be gone two days later. Prof. Axhausen argues for better connections, easier transfers, prioritization at traffic signals, more bus lanes and changes to the route network to make public transport more attractive (Raaflaub, 2020).
Other criticisms include the rebound effect, which could lead to people traveling excessively by bus or tram, ultimately increasing traffic, emissions and urban sprawl, and fears that the quality of public transportation could deteriorate (more pollution from overcrowded buses and streetcars). Another point of criticism is that studies conclude that only a few people who previously travelled by car subsequently switched to free public transport. Most of the additional public transport users were mainly pedestrians, cyclists, and people who generally travelled less before, according to another study. The same is true in Tallinn where, although public transport has increased from 55 to 63 percent, the car share of traffic has only been reduced from 31 to 28 percent, while walking has fallen from 12 to 7 percent. According to the study, free public transportation would hardly change the mobility behaviour of car and motorcycle drivers (Pallinger, 2021). Another study in France concludes that while the measure would increase ridership by 6 to 10 percent, it would cost between €2.2 billion and €3.3 billion, the quality of service of the network would be compromised, car use would decrease by only 2 percent, and the impact on social equity would be limited because more than one million people in the region studied already benefit from free or reduced fares (Mabill & Dugue, 2018). A greater change, according to some experts, could be brought about by measures such as higher parking fees or fuel prices. Instead of a general ticket exemption, poorer population groups could also be helped directly, for example by cheaper tickets for low income households. This would leave the government or the public transport company with most of the revenue from ticket sales (Pallinger, 2021). However, proponents of free public transport in France believe that the costs are overestimated and point to a tax (a so-called mobility tax) that is levied on all companies in France. This subsidizes collective transport and results in ticket sales accounting for only about 10-15% of revenue in most cities. In the case of Dunkirk, this tax covered the cost of eliminating ticket prices, which represented 10% of revenue (Yeung, 2021).
Relevant initiatives in Austria
Since 26th October 2021 in Austria “KlimaTicket” (climate ticket) is available for a standard price of €1.095 per year (€3 per day) giving access to all public transports in Austria.
Impacts with respect to Sustainable Development Goals (SDGs)
| Impact level | Indicator | Impact direction | Goal description and number | Source |
|---|---|---|---|---|
| Individual | Higher societal equity and public transport accessibility | + | Equality (5,10) | Brown, 2018; Pallinger, 2021 |
| Individual | Reduction in sustainable transport modes (e.g. walking) due to increased use of free public transport | - | Environmental sustainability (7,12,13,15) | Pallinger, 2021 |
| Systemic | Reduced carbon emissions | + | Environmental sustainability (7,12,13,15) | Yeung, 2021 |
| Systemic | Potentially excessive trips by public transport may decrease its quality | - | Sustainable economic development (8,11) | Raaflaub, 2020 |
References
- Krakow.pl (2021). Rodzaje biletów. Available at: https://www.krakow.pl/14904,artykul,rodzaje_biletow.html. [Accessed: 1st June 2021]
- McKone, J. (2010). Time-Based Versus Distance-Based Fares. Available at: https://thecityfix.com/blog/time-based-versus-distance-based-fares/#:~:text=Time%2Dbased%20systems%20allow%20passengers,a%20set%20amount%20of%20time.&text=Distance%2Dbased%20systems%20charge%20higher,rides%20that%20cover%20greater%20distances. [Accessed: 1st June 2021]
- Wiener Linien.at (2021). Ticket guide. Available at: https://www.wienerlinien.at/eportal3/ep/channelView.do/pageTypeId/66533/channelId/-47643 [Accessed: 1st June 2021]
- ADAC. (2019, June 19). ÖPNV-Preisvergleich 2019: Wo Tickets teuer und wo sie günstig sind | ADAC. https://www.adac.de/reise-freizeit/ratgeber/tests/oepnv-preise-vergleich/
- Brown, A. E. (2018). Fair fares? How flat and variable fares affect transit equity in Los Angeles. Case Studies on Transport Policy, 6(4), 765–773. https://doi.org/10.1016/J.CSTP.2018.09.011
- Bull, O., Munoz, J. C., Silva, H. E. (2021). Impact of fare-free public transport on travel behavior: Evidence from a randomized controlled trial. Regional Science and Urban Economics. 86, 103616. https://doi.org/10.1016/j.regsciurbeco.2020.103616
- Cats, O., Susilo, Y. O., & Reimal, T. (2017). The prospects of fare-free public transport: evidence from Tallinn. Transportation, 44(5), 1083–1104. https://doi.org/10.1007/s11116-016-9695-5
- Chalabianlou, R., Lawrence, A., & Baxter, B. (2015). A review and assessment of fare capping as a passenger incentive mechanism for Australia and New Zealand. ATRF 2015 - Australasian Transport Research Forum 2015, Proceedings, October, 1–15.
- El-Geneidy, A., Levinson, D., Diab, E., Boisjoly, G., Verbich, D., & Loong, C. (2016). The cost of equity: Assessing transit accessibility and social disparity using total travel cost. Transportation Research Part A: Policy and Practice, 91, 302–316. https://doi.org/10.1016/j.tra.2016.07.003
- Guzman, L. A., de la Hoz, D., & Monzón, A. (2014). Optimal and Long-Term Dynamic Transport Policy Design: Seeking Maximum Social Welfare through a Pricing Scheme. International Journal of Sustainable Transportation, 8(4), 297–316. https://doi.org/10.1080/15568318.2012.696772
- Hojski, D., Hazemali, D., Lep, M. (2022). The Analysis of the Effects of a Fare Free Public Transport Travel Demand Based on E-Ticketing. Sustainability. 14 (10), 5878. https://doi.org/10.3390/su14105878
- Los Angeles County Metropolitan Transportation Authority. (2021). LA Metro Rider Relief. https://www.metro.net/projects/rider_relief/
- Mabill, S., & Dugue, H. (2018). Rapport du Comité sur la faisabilité de la gratuité des transports en commun en Île-de-France, leur financement et la politique de tarification. 2018–2019. https://www.iledefrance-mobilites.fr/wp-content/uploads/2018/10/Rapport-Comité-sur-la-faisabilité-de-la-gratuité-des-transports-en-commun-en-Île-de-France-leur-financement-et-la-politique-de-tarification.pdf
- Martens, K. (2012). Justice in transport as justice in accessibility: Applying Walzer’s “Spheres of Justice” to the transport sector. Transportation, 39(6), 1035–1053. https://doi.org/10.1007/s11116-012-9388-7
- Pallinger, J. (2021, June 5). Was kostenlose Öffis bringen sollen - Zukunft - derStandard.de › Wissen und Gesellschaft. https://www.derstandard.de/story/2000127046621/was-kostenlose-oeffis-bringen-sollen
- Raaflaub, C. (2020, February 27). Warum die Idee vom Gratis-ÖV in der Schweiz nicht ankommt - SWI swissinfo.ch. https://www.swissinfo.ch/ger/verkehr-und-umweltschutz_warum-die-idee-vom-gratis-oev-in-der-schweiz-nicht-ankommt/45578796
- Rubensson, I., Susilo, Y., & Cats, O. (2020). Is flat fare fair? Equity impact of fare scheme change. Transport Policy, 91, 48–58. https://doi.org/10.1016/J.TRANPOL.2020.03.013
- San Francisco Municipal Transportation Agency. (2021, January). Lifeline Pass | SFMTA. https://www.sfmta.com/fares/lifeline-pass
- statista.at. (2017, April). ÖPNV - Preise für Standard-Einzeltickets weltweit 2017 | Statista. https://de.statista.com/statistik/daten/studie/168444/umfrage/preise-fuer-standard-einzeltickets-des-oepnv-in-ausgewaehlten-staedten/
- Streeting, M., & Charles, P. (2006). Developments in transit fare policy reform. 29th Australasian Transport Research Forum, ATRF 06, 1–13.
- Tomes, Z., Fitzova, H., Paril, V., Rederer, V., Kordova, Z., Kasa, M. (2022). Discounts and ree fares in long-dinstance public transport in central Europe. Case Studies on Transport Policy. 10, 507-517. https://doi.org/10.1016/j.cstp.2022.01.011
- Wang, S., Liu, Y., & Corcoran, J. (2021). Equity of public transport costs before and after a fare policy reform: An empirical evaluation using smartcard data. Transportation Research Part A: Policy and Practice, 144, 104–118. https://doi.org/10.1016/J.TRA.2020.12.010
- Yeung, P. (2021, May 24). How France is testing free public transport - BBC Worklife. https://www.bbc.com/worklife/article/20210519-how-france-is-testing-free-public-transport
- Yoh, A. C., Taylor, B. D., & Gahbauer, J. (2016). Does Transit Mean Business? Reconciling Economic, Organizational, and Political Perspectives on Variable Transit Fares. Public Works Management and Policy, 21(2), 157–172. https://doi.org/10.1177/1087724X15616816
- Zhao, P., & Zhang, Y. (2019). The effects of metro fare increase on transport equity: New evidence from Beijing. Transport Policy, 74, 73–83. https://doi.org/10.1016/J.TRANPOL.2018.11.009
7.3 Mobility as a service (Maas)
Updated: 13th July 2022
Definition
In line with the principle of “using instead of owning”, one goal of MaaS is to make mobility available as a service anytime and anywhere with a click on one or more online platforms or apps. These digital MaaS platforms or apps should link information, booking and payment of mobility offers from different service providers and thus enable the offer of integrated mobility packages. Users should have the freedom to choose between different physical forms of mobility (Neumann & Rauch, 2021):
- public transport such as train, bus, rapid transit, tram and metro
- private services such as taxis
- services for car, ride, (e-)bike, (e-)scooter sharing or fixed route taxis
- volunteer-run community buses
- aircrafts and ships
- (in the future) autonomous, driverless vehicles
MaaS solutions can be built up in stages. The first stage consists of a bundling of information from different providers so that all available mobility offers are displayed for the entire journey from start to destination. Stage two includes planning routes according to customers’ priorities and the possibility to book and pay for all means of transport used for the journey at once. In addition, real-time information for the route is included, such as changes in journey and waiting times due to unforeseen events - such as accidents or weather conditions – as well as continuous notifications about alternative options. Stage three consists of a mobility guarantee by means of a customised mobility package based on personal needs and preferences, e.g. in the form of a monthly subscription (Neumann & Rauch, 2021).
The aim of MaaS is to provide an alternative to the private use of cars, thus equally convenient, even cheaper, but more sustainable (Maas Alliance, 2015). The theory of MaaS opens up new business areas and enables mobility service providers to increase their customer base. The usage data generated by the ongoing operation can help to get to know customers better and thus to work more efficiently, as it would be easier to plan the orientation and distribution of the services. A well-functioning MaaS system requires the willingness of private and public mobility providers to cooperate with each other and with the platform operators (MaaS providers) (Neumann & Rauch, 2021). Moreover, it relies heavily on availability of high-quality data. To enforce safe and secure real-time access to data , is equally important as ensuring the clarity regarding liabilities of parties with principal control over the data (Maas Alliance, 2015). The first step towards MaaS is the harmonization of data, supported by appropriate regulations and standards (Maas Alliance, 2015). In Austria, both researchers and mobility service providers are researching how to best implement MaaS. One example is the ULTIMOB research project.
Key stakeholders
- Affected: Customers/Users
- Responsible: Transport service providers and public transport operators, MaaS operators and integrators, IT system providers, city councils, local, regional and national authorities
Current state of art in research
In order to support the cooperation between private and public mobility providers as well as platform operators (MaaS providers), the legal and organizational framework conditions as well as standards for a secure and fair exchange of data should be created at European and Austrian level (Neumann & Rauch, 2021).
In 2015 the MaaS Alliance, a public-private partnership, working to establish foundations for a common approach to MaaS, was founded, with the main goal, to facilitate a single, open market and full deployment of MaaS services (Maas Alliance, 2015).
The research and development project MaaS4EU, which is funded by the Horizon2020 research and innovation programme, brings together 17 partners from several sectors and backgrounds to provide viable evidence and solutions about the MaaS concept. The project aims to remove barriers and enable a cooperative and interconnected EU single transport market for the MaaS concept, by addressing the four pillars:
- business models
- end-users
- technology
- policy
Therefore, the holistic MaaS4EU solutions are demonstrated and validated in real life via Living Labs in Greater Manchester (UK), Luxembourg-Germany, and Budapest (Hungary) (MaaS4EU, 2017). In summmary, current research is mainly working on the development of different MaaS app/platform prototypes, that will offer a multimodal travel solution. One example is the project TrønderMaaS of Marinelli et al. (2020) who is operating a full-scale pilot test in the Trondheim-Stjørdal region, Norway.
Literature reviews reveal a reduction in vehicle kilometres travelled, increased trip awareness, reduced parking, reduced vehicle ownership and improved social equity through implementation of MaaS. Barriers of MaaS supply are public private cooperation, business support, service coverage, shared vision and data/cyber security. On the demand side, barriers include its lack of appeal to older generations, public transport and private vehicle users, the attractiveness of the digital platform and the user willingness-to-pay (Buttler et al., 2021). Feneri et al. (2020) found, that it is not only the price but the combination of monthly fees and the discounts for various transportation modes within a specific MaaS bundle that increases or decreases its use. Hensher et al. (2021) provided similar findings that MaaS programs have the ability to increase or decrease the use of private cars, depending on the offered bundles. This suggests a reasoned approach, evaluated for each case separately, to be in compliance with the sustainability goals.
ITS Austria presents three levels of readiness for MaaS miA (Mobility as a Service made in Austria) (ITS Austria, 2019):
- Level 0: no integration and coordination of mobility services/offers
- Level 1: 1a) integration of information, 1b) integration of offers
- Level 2: contractible offers (fusion of large parts of relevant mobility offers)
- Level 3: integration of agreements (mobility package and guarantee)
Current state of art in practice
The first pilot trial in Sweden started in 2013 with the plattform Ubi-Go. In April 2019 the App was launched and is looking for franchise partners since 2020 while Finland started its first MaaS platform in 2015, named whim, being the first commercially used combined mobility platform. Whim is now available in countries like Switzerland, Japan, Austria, Belgium and the UK (Whim, 2022; Ubi-Go, 2022).
In 2019 Berlin’s public transport authority Berliner Verkehrsbetriebe (BVG) invented and implemented together with the Lithuanian start-up and MaaS solution leader Trafi the mobility app called Jelbi, which counts as the world’s most extensive Mobility as a Service-solution (Rastenytė, 2020). The app covers assistance planning and routes discovery, real-time public transport information and shared mobility vehicle location and availability, a streamlined payment solution for any integrated mobility service, as well as the possibility to compare the duration and cost of each trip (Rastenytė, 2020).
In 2020, Switzerland followed and integrated an app called yumuv. Swiss Federal Railways SBB CFF FFS, PTOs of Verkehrsbetriebe Zürich, Basler Verkehrs-Betriebe (BVB), and BERNMOBIL cooperated also with the start-up Trafi and managed to create the first regional MaaS with subscriptions (Trafi Ltd., 2020).
On national level there is wegfinder (in all of Austria), Wien Mobil for the city of Vienna and tim-App in Graz and Linz.
Impacts with respect to Sustainable Development Goals (SDGs)
| Impact level | Indicator | Impact direction | Goal description and number | Source |
|---|---|---|---|---|
| Individual | Facilitated accessibility to transport | + | Equality (5,10) | Gudonavicius, 2020 |
| Individual | Use of active transport modes increased/Fuel consumption decreased | + | Environmental sustainability (7,12,13,15) | Gudonavicius, 2020 |
| Individual | Higher accessibility & faster travel time | + | Sustainable economic development (8,11) | Gudonavicius, 2020; Marinelli et al., 2020 |
| Individual | Use of digitalized transport | + | Innovation & Infrastructure (9) | Gudonavicius, 2020; Marinelli et al., 2020 |
| Systemic | Transport safety increased/Collision rates reduced | + | Health & Wellbeing (3) | Gudonavicius, 2020; Marinelli et al., 2020 |
| Systemic | Emissions rate reduced | + | Environmental sustainability (7,12,13,15) | Gudonavicius, 2020 |
| Systemic | Traffic efficiency | + | Sustainable economic development (8,11) | Gudonavicius, 2020 |
| Systemic | Efficiency of transport systems, increased resilience through real-time data | + | Innovation & Infrastructure (9) | Marinelli et al., 2020 |
| Systemic | Collaborations of private and public sectors & global partnerships | + | Partnership & collaborations (17) | Gudonavicius, 2020; Marinelli et al., 2020 |
Open questions
- How can a sustainability transformation be reached through MaaS and what circumstances does it require?
- How can data protection be ensured when using MaaS?
- How fast is MaaS going to be implemented?
- How can bureaucratic hurdles be overcome in a timely manner?
References
- Butler, L., Yigitcanlar, T., Paz, A. (2021). Barriers and risks of Mobility-as-a-Service (MaaS) adoption in cities: A systematic review of the literature. Cities. 109, 103036. https://doi.org/10.1016/j.cities.2020.103036
- Feneri, A-M., Rasouli, S., Timmermans, H.J.P. (2020). Modeling the effect of Mobility-as-a-Service on mode choice decisions. Transportation Letters. 14 (4), 324-331. https://doi.org/10.1080/19427867.2020.1730025
- Fluidtime (2022). Ubi-Go App. Available at: https://www.fluidtime.com/en/ubigo/ [Accessed: 11th July 2022]
- Gudonavičius, M. (2020). Unjamming Urban Mobility: How Mobility-as-a-Service Can Replace Personal Cars. https://www.trafi.com/wp-content/uploads/2020/08/unjamming-urban-mobility.pdf
- Maas Alliance. (2015). White Paper: Guidelines & Recommendations to create the foundation for a thriving MaaS Ecosystem. 32(2), 1–27. https://maas-alliance.eu/wp-content/uploads/sites/7/2017/09/MaaS-WhitePaper_final_040917-2.pdf
- Hensher, D., Ho, C. Q., Reck, D. J. (2021). Mobility as a service and private car use: Evidence from the Sydney MaaS trial. Transportation Research Part A: Policy and Practice. 145, 17-33. https://doi.org/10.1016/j.tra.2020.12.015
- MaaS4EU. (2017, October). Launch of MaaS4EU project. http://www.maas4eu.eu/wp-content/uploads/2017/10/MaaS4EU-Launch-Press-Release.pdf
- Marinelli, G., Nordfjærn, Ö. S., Aarseth, W., & Pitera, K. (2020). Introducing TrønderMaaS: investigating business models, sustainability and users’ acceptance of a MaaS system in Stjørdal and Trondheim region, Norway.
- Neumann, A., & Rauch, A. (2021). Maas Ready. https://maas-ready.at/allgemein#Grundidee
- Rastenytė, J. (2020, April 24). BVG Jelbi – Case Study: World’s Most Extensive MaaS in Berlin – Trafi. https://www.trafi.com/bvg-jelbi-maas-berlin/
- Trafi Ltd. (2020). yumuv – Regional MaaS with subscriptions in Switzerland – Trafi. https://www.trafi.com/yumuv/
- Whim-App (2022). Available at: https://whimapp.com/ [Accessed: 11th July 2022]
7.4 Park and ride
Updated: 1st August 2022
Definition
Some of the main challenges the world is currently facing are related to population growth and urbanisation. The massive growth of cities has created major transport challenges that manifest themselves in traffic congestion in urban areas, especially in city centres. Many of the efforts to reduce congestion attempt to increase vehicle occupancy by inducing a shift from single occupancy vehicles (SOVs) to multiple occupancy vehicles or encouraging use of various transit modes. One example of such effort are park-and-ride facilities which attempt to reduce car use and increase road efficiency.
Park-and-ride facilities are usually located in peri-urban areas in a proximity to bus or train station to allow drivers coming from suburban and rural areas to park their cars and transfer to public transport to reach urban destinations. Park-and-ride facilities, introduced in England in the 1970s, appear to offer a simple and cost-effective alternative to building new roads. These facilities are usually accompanied by good public transport services to urban areas (Katoshevski-Cavari, Bak and Shiftan, 2018).
Key stakeholders
- Affected: Car drivers coming from suburban and rural areas
- Responsible: National Governments, Communal Governments, City governments, Parking Companies
Current state of art in research
In terms of P&R research, existing publications address topics such as the optimal location problem of P&R facilities, the relationship between private vehicle use patterns and the number and density of P&R facilities in a city, the empirical study of P&R facility use patterns, the study of P&R motives and air quality standards in Europe, the influence of P&R facilities on vehicle kilometres travelled, the analysis of travellers’ stated intention to use parking and cycling facilities (P+R, B+R), empirical analysis of P&R facility choice behaviour, attitude surveys of P&R and non-P&R users and the influence of multimodal information on the use of P&R (Gan and Ye, 2018).
Studies show that some public transport users were attracted to switch to multiple modes of transport (i.e. park-and-ride), which increased the number of car trips. Nonetheless, additional car trips are made in non-congested areas, thus contributing to traffic relief (Katoshevski-Cavari, Bak and Shiftan, 2018).
The exact effects of P&R are controversial. Some studies have confirmed that P&R facilities can encourage the use of public transport, relieve urban traffic and reduce car emissions in city centres. Other studies pointed to possible counter-effects of P&R. The reduction of congestion in city centres might encourage motorists to use their cars in the city again, as accessibility has increased, and motorists travelling to the city centre via P&R facilities might travel some extra kilometres to reach the P&R facility. The exact weight of these negative externalities is still debatable (and will vary from place to place), as is the direct net benefit of P&R on car traffic in the city area as a whole. However, it is undisputed that well-used P&R facilities directly reduce car traffic in the city centre (Dijk and Montalvo, 2011), especially if the travel behaviour in a certain area was well-researched which is a key element to be able to convince travellers to switch to a multi-modal travel (Memon et al., 2021). A recent study showed, based on an agent simulation system, that compared with reducing the public transport fares, reducing the waiting times can attract car travellers to choose park and ride while the co-existence of a reservation scheme can reduce cruising and improve traffic environment (Zhenyu et al., 2022). Further, Bruck and Soteropoulos (2021) stated, that under future circumstances of (shared) automated vehicles, Park and Ride facilities might need to be transformed to mobility hubs, to make it possible to accommodate future autonomous shuttle fleets.
Current state of art in practice
Parking management has evolved greatly in Europe over the last decades, and P&R has emerged as one of the newest elements of urban parking management. Virtually all urban areas are facing growing parking demand. More parking spaces lead to growing problems of urban congestion and pollution from traffic. Many cities have responded with policies aimed at improving the utilisation of existing infrastructure (e.g. through pricing or automatic display of parking capacity) and building new infrastructure at structural bottlenecks. The typical development of urban parking policies can be presented in seven phases (Dijk and Montalvo, 2011):
- No parking measures: This phase is sustainable until the level of parked cars has a negative impact on the attractiveness and quality of the area.
- Regulation and control of parking: This means banning parking in some streets.
- Time restrictions (free of charge): This leads to more efficient use of available space through increased turnover of cars.
- Paid parking: Parking tariffs are used as a key to control the use of parking spaces.
- Resident parking schemes: Overflow of parkers into neighbouring areas (often residential) requires resident parking regulations.
- P&R facilities: These are being developed as an alternative or supplement to parking provision in the town centre.
- Mobility management: It includes various activities to coordinate the combination of private and public transport to create an acceptable mobility chain for travellers.
Moreover, the results of a survey show that a quarter of the cities in Europe are intensively engaged in P + R development, while about 50% of them is moderately engaged. Geographically, it shows that cities in north-western Europe have a higher level of engagement than cities in southern and eastern Europe. Furthermore, the understanding of P&R in European cities is strongly different, revealing current beliefs about P&R.
Park-and-Ride is certainly not the only transport policy initiative in the city to improve accessibility and quality of life in the city. Most cities apply combination of measures. P&R is valued as part of such a package, but not seen as the perfect package. Most cities consider P&R as a “Plan B” (Dijk and Montalvo, 2011).
In Germany, some P&R facilities were tested by the ADAC. Many P&R facilities had deficiencies - most of them were missing equipment features:
- The testers hardly found any video surveillance, and forecasts of occupancy on the Internet were also scarce;
- No car park had continuous footpaths and safe separation between pedestrians and cars;
- In 25% of facilities, there were not enough parking spaces available, showing a gap between supply and demand.
- Some of the public transport services were also unsatisfactory, with too long waiting/transfer time. The likelihood of choosing P + R facility decreases with longer public transport travel and waiting times (Islam et al., 2015).
The facilities scored best in the category of information and prices. Two thirds had clear signage and provided comprehensible information on their websites about location, size and prices. Two of them were particularly positive: they published online forecasts of available parking spaces so that drivers could estimate in advance when parking spaces would be available. The Bremen-Burg P&R facility offered additional useful service: a display board showed free parking spaces and the departure times of the next two trains.
In passenger traffic, commuters do not want to wait long for their train. The frequency of public transport therefore has a significant impact on whether a P&R facility is accepted at all. In one third of the facilities, the connection to the public transport network (travel time ratio, frequency, routes to the station) was poor or very poor.
The testers checked lighting, digital or personal surveillance, recognisable separation between parking spaces and the roadway, and whether the transition from the car park to the station was safe. Overall, the study showed that current level of safety is unsatisfactory.
Recommendations for operators:
- Provide information about P&R facilities on the Internet
- Pave, regularly maintain and clean the entire P&R facility - including temporary parking spaces.
- Make parking spaces at least 2.50 metres wide so that users can get on and off without difficulty.
- Keep footpaths short and safely separated from the roadway, clearly mark parking spaces and regularly tighten faded markings.
- Provide charging infrastructure for electric vehicles
- In multi-storey car parks, provide more security through video surveillance, good visibility, functioning emergency calls and comprehensive lighting
- Manage P&R facilities at high occupancy rates (user fees, parking time restrictions) in order to avoid misuse.
Recommendations for municipalities & public transport:
- Planning on a large scale and regionally already when developing areas for P&R facilities.
- Where demand is particularly high and space is available, create more P&R spaces - possibly also by building parking decks.
- Ensure good public transport connections to the city centre with short intervals.
- Avoid large jumps in fares, if necessary integrate selected P&R facilities into cheaper fare groups.
- Combine Bike+Ride and P&R facilities to make it possible for residents from the immediate vicinity to reach the facility by bicycle instead of by car (Luca and Dommnich, 2018).
Relevant initiatives in Austria
ÖBB is investing 700 million euros in the expansion of infrastructure in the eastern region in the next years, staring in 2021. Two thirds of rail passengers in Austria travel in Lower Austria, Vienna and Burgenland, where lines are being extended, stations renovated and new park-and-ride facilities built (Frey, 2021). In Vienna, Lower Austria and Burgenland, more than 40,000 parking spaces are available at over 200 Park/B+R facilities for easy transfers. In Vienna, most P&R facilities charge a small fee of € 3.60 per day. In Lower Austria and Burgenland, the use of P&R facilities is free of charge for public transport passengers (VOR.at, n.d.), while in Vienna, holders of a valid monthly or yearly public transport ticket get reduced monthly and yearly P&R tickets (WiPark.at, 2022). Further, in May 2022 a new access system at the P+R facility in St. Pölten was implemented, which allows easier access for all owners of permanent tickets due to number plate recognition at the entrance and exit (Schrefl, 2022).
Impacts with respect to Sustainable Development Goals (SDGs)
| Impact level | Indicator | Impact direction | Goal description and number | Source |
|---|---|---|---|---|
| Individual | Reduced initial congestion in city centres | ~ | Health & Wellbeing (3) | Dijk & Montalvo, 2011 |
| Individual | Increased access to public transport & multimodal travel | + | Equality (5,10) | Macioszek & Kurek, 2020 |
| Individual | Low cost or free of charge | + | Sustainable economic development (8,11) | VOR.at, n.d. |
| Systemic | Ambiguous impact on emissions | ~ | Environmental sustainability (7,12-13,15) | Moore et al., 2019; ITF, n.d. |
| Systemic | New infrastructure built | + | Innovation & Infrastructure (9) | Frey, 2021 |
Open questions
- How to encourage non-commuters to use P&R?
- How will demand for P&R parking change over time, especially with the rapid changes associated with the introduction of autonomous vehicles?
- What is the potential of P&R in facilitating multimodal transport at the advent of integrated travel apps?
References
- Bruck, E. M., Soteropoulos, A. (2021). Traffic-land use compatibility and street design impacts of automated driving in Vienna, Austria. The Journal of Transport and Land Use. 15, 1. 137-163. http://dx.doi.org/10.5198/jtlu.2022.2089
- Dijk, M., & Montalvo, C. (2011). Policy frames of Park-and-Ride in Europe. Journal of Transport Geography, 19(6), 1106–1119. https://doi.org/10.1016/j.jtrangeo.2011.05.007
- Frey, F. (2021, January 6). ÖBB: 700 Mio. Euro für Infrastrukturausbau - noe.ORF.at. https://noe.orf.at/stories/3083619/
- Gan, H., & Ye, X. (2018). Will commute drivers switch to park-and-ride under the influence of multimodal traveler information? A stated preference investigation. Transportation Research Part F: Traffic Psychology and Behaviour, 56, 354–361. https://doi.org/10.1016/j.trf.2018.05.015
- Islam, S. T., Liu, Z., Sarvi, M., & Zhu, T. (2015). Exploring the mode change behavior of park-and-ride users. Mathematical Problems in Engineering, 2015.
- ITF. (n.d.) Park and ride facilities. Available at: https://www.itf-oecd.org/policy/park-and-ride-facilities [Accessed: 3 March 2021].
- Katoshevski-Cavari, R., Bak, N., & Shiftan, Y. (2018). Would free park-and-ride with a free shuttle service attract car drivers? Case Studies on Transport Policy, 6(2), 206–213. https://doi.org/10.1016/j.cstp.2018.05.001
- Luca, K., & Dommnich, B. (2018, August 6). 60 P+R-Anlagen im Test | ADAC. https://www.adac.de/reise-freizeit/ratgeber/tests/park-ride/
- Macioszek, E., & Kurek, A. (2020). The use of a park and ride system—A case study based on the city of Cracow (Poland). Energies, 13(13), 3473.
- Memon, I. A., Kalwar, S., Sahito, N., Talpur, M. H., Chandio, I. A., Napiah, M., Tayyeb, H. (2021). Mode Choice Modeling to Shift Car Travellers towards Park and Ride Service in the City centre of Karachi. Sustainability. 13(10), 5638. https://doi.org/10.3390/su13105638
- Moore, A. M., Curran, S. J., Lapsa, M. V., & Bittler, A. D. (2019). Geoanalysis of park-and-ride facilities for future laboratory-wide commuting program. Transportation Research Interdisciplinary Perspectives, 3, 100025. https://doi.org/10.1016/j.trip.2019.100025
- Schrefl, K. (2022). MeinBezirk.at: Park & Ride Anlagen bekommen ein neues Zufahrtssystem. Available at: https://www.meinbezirk.at/st-poelten/c-lokales/park-und-ride-anlagen-bekommen-ein-neues-zufahrtssystem_a5280277 [Accessed: 19 July 2022]
- VOR.at. (n.d.). Park/Bike+Ride - VOR. Available at: https://www.vor.at/mobil/parkbike-ride/ [Accessed: 26 February 2021]
- WiPark.at. (2022). Park and Ride (P+R) – Ihr Parkplatz an der U-Bahn oder S-Bahn. Available at: https://www.wipark.at/parkprodukte/angebote/park-and-ride [Accessed: 19 July 2022]
- Zhenyu, M., Daqin, W., Wenchao, D., Dianhai, W., Dongfang, M. (2022). Multi-Agent Simulation for Multi-Mode Travel Policy to Improve Park and Ride Efficiency. Available at SSRN: https://dx.doi.org/10.2139/ssrn.4151394
7.5 Contactless public transport cards
Updated: 1st August 2022
Definition
Smart card ticketing means, that the passenger’s entitlement to travel is stored electronically on a chip that is usually embedded in a plastic card and validated when the card is presented to a smart reader (Turner & Wilson, 2010). On the contrary to contact smart cards, which have to be inserted into a smart card reader, contactless smart cards must only be near to the readers (about 10 cm) to exchange data (Mezghani, 2008). There are three types of standards used, called Type A, Type B (both complying with ISO 14443 standard) and FeliCa, while FeliCa provides faster transmission and is mainly used in Asian countries (Kurauchi & Schmöcker, 2017).
Smart and integrated ticketing systems are expected to deliver greater flexibility and simplicity for passengers, by offering increased speed, convenience and security against loss and theft (Turner & Wilson, 2010). Economic and societal benefits from smart cards ticketing include the reduction in costs as a result of fewer paper tickets being sold, reduced queuing time, faster throughput of passengers at ticket gates, reduced boarding time for buses and reduced loss of revenue through fraud (Turner & Wilson, 2010).
England’s Department of Transport has planned a strategy, to introduce integrated and smart ticketing to the majority of the UK by 2020. Their research suggests that net annual benefits of over £1 billion per year to passengers, operators and local authorities can be the result (Turner & Wilson, 2010).
Another advantage of using smart cards ticketing, is the large amount of data on passengers’ behaviour, which can be collected with lower cost (Kurauchi & Schmöcker, 2017). In Austria smart cards have not been implemented on a large scale. Only the City of Wales has smart cards for the public transport in use (Wels Linien). ÖBB (ÖBB, 2021) and Wiener Linien (Wiener Linien, 2021) don’t have smart cards in use, but online tickets for smart phones, using QR Codes. Wiener Linien are currently researching on a more efficient solution for the usage of digital tickets, since they developed, that ticket controls of digital tickets take longer than for paper tickets (Wiener Linien, 2021b).
Key stakeholders
- Affected: Public transport users, ticket inspectors
- Responsible: Public transport operators, public transport associations, public transport authorities, smart card producers, Industry suppliers
Current state of art in research
The latest research goes in the direction of using smart phones or other mobile devices for smart ticketing. An initiative, led by NFC Forum and GSMA achieved in 2015 together with global public transport representatives, the Smart Ticketing Alliance and the JR East as well as standards bodies, including CEN and ISO, harmonizing the specifications of mobile device NFC interfaces and public transport readers and cards. Together they established standards for testing mobile devices and public transport equipment (NFC Forum, 2016).
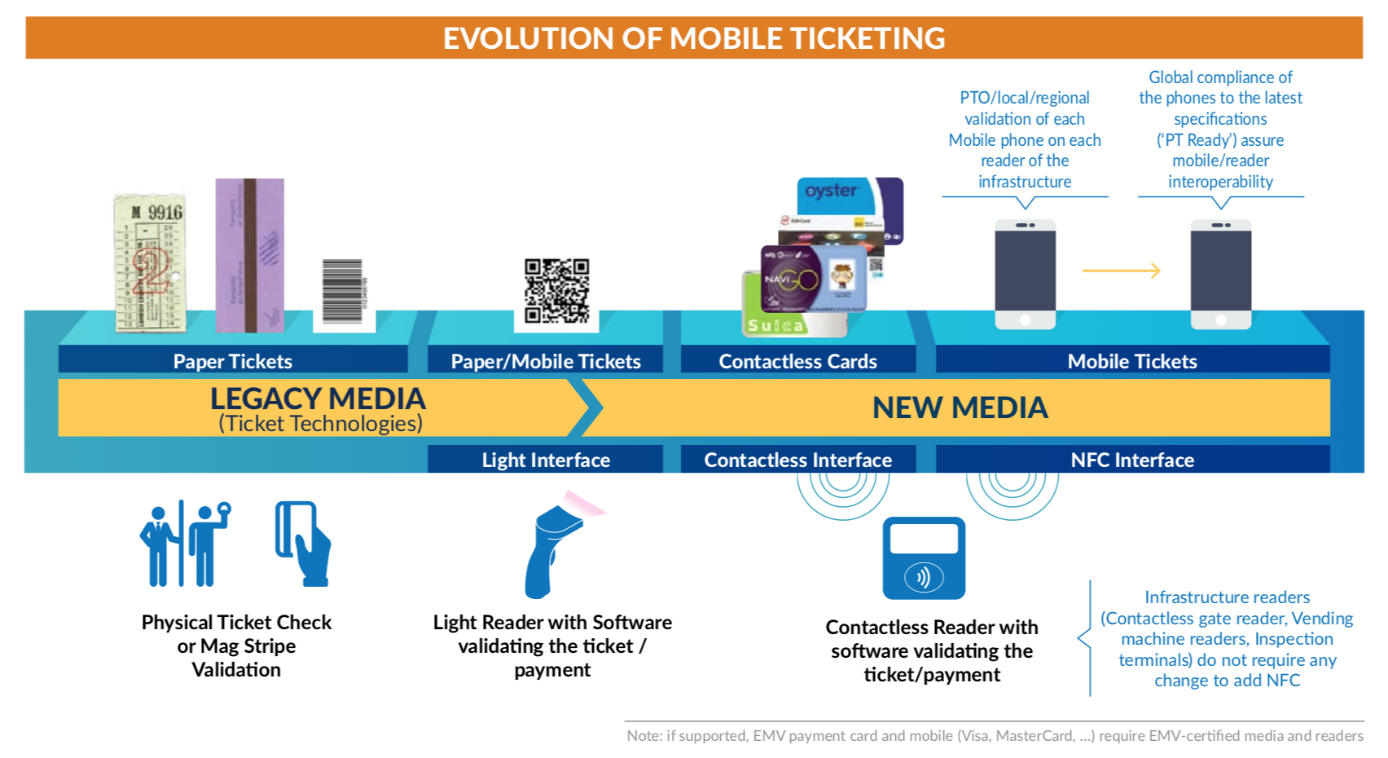
Figure 7.5: The evolution of mobile ticketing (NFC Forum, 2016)
Furthermore, current research addresses the issues of big data and how collected data through contactless smart cards can be best analysed (see Kurauchi & Schmöcker, 2017). Recent studies investigated a prototype of the BI/BO (be in/be out) system, working in the public transport system in Lodz, Poland. The Passenger BIBO and automation of the CICO (check-in/check-out) give rise to a new approach to an integrated passenger identification model by applying machine learning technologies and using Internet of Things (IoT), through beacons and smartphones. It enables wireless connection with the use of bluetooth and automatic detection of passengers (Hasimi et al., 2021; Mastalerz et al, 2020). Bieler et al. (2022) explored solutions for automated fare collection in public transportation and found significant positive impacts on consumer experiences and reduction of pollutant emissions in urban transportation due to a more seamless and efficient fare collection systems.
Current state of art in practice
Many countries, regions or cities, have smart card ticketing systems in use, like the whole of Netherlands, Helsinki Region, Minsk, Berlin, Auckland, Sydney and many more (see Wikipedia contributors, 2021). The systems itself differ and depend on the local ticketing and fare systems. While London, for instance, is using an access control system, Helsinki’s system is trust based. Furthermore, a distinction can be made between pre-paid (debit) and post-paid (credit) systems (Kurauchi & Schmöcker, 2017). Current CICO (check in/check out) systems are available as the Oyster Card in London, the EZ-Link Card in Singapur, OV-chipkaart in Amsterdam, LisboaViva Card in Lisbon, go card in Brisbane, Octopus in Hongkong, AltoAdige Pass in SüdTyrol (Eilmes et al., 2014), while BIBO systems (be in/be out) have only been tested, but not been implemented on a wide range (N.N., 2009). Furthermore, Biometric Ticketing (e.g. by facial recognition) is tested in various countries (China: Shenzhen Metro, Japan: Osaka Metro, London: Eurostar) and by Amazon (Singh, 2021).
Impacts with respect to Sustainable Development Goals (SDGs)
| Impact level | Indicator | Impact direction | Goal description and number | Source |
|---|---|---|---|---|
| Individual | Personal, travel expenditure reduced | + | Sustainable economic development (8,11) | Turner & Wilson, 2010 |
| Individual | Access to digitalised transport | + | Innovation & Infrastructure (9) | Turner & Wilson, 2010 |
| Systemic | Public transport capacity increases | + | Sustainable economic development (8,11) | Turner & Wilson, 2010 |
| Systemic | Facilitates integration of the fare systems of several operators within a city | + | Partnership & collaborations (17) | Kurauchi & Schmoecker, 2017 |
Open questions
- How can the large amount of provided data be best used?
- What advantages and disadvantages would an implementation in the main cities of Austria have?
References
- Bieler, M., Skretting, A., Büdinger, P., Gronli, T.-M. 2022. Survey of Automated Fare Collection Solutions in Public Transportation. IEEE Transactions on Intelligent Transport Systems. Doi: 10.1109/TITS.2022.3161606
- Eilmes, B., Zietz, A., Szombathely, M., Quast, F., Blanckmeister, C., Schmiede, A. 2014. CICO-, CIBO und BIBO-basierte ÖPNV-Vertriebssysteme in Ballungsräumen weltweit (Markterkundung). VRR: Verkehrsverbung Rhei-Ruhr AöR. Available at: https://docplayer.org/storage/18/893383/1658415222/cRaJu2SV6CLCYsoiVAwLEQ/893383.pdf [Accessed: 21 July 2022]
- Hasimi, L., Poniszewska-Maranda, A., Krym, T. 2021. Smart City Concept Using BI/BO Model for the Ticket System in Urban Transport. IEEE Transactions on Intelligent Transport Systems. https://doi.org/10.23919/SoftCOM52868.2021.9559116
- Kurauchi, F., & Schmöcker, J. D. (Eds.). (2017). Public transport planning with smart card data. CRC Press.
- Mastalerz, M., Malinowski, A., Kwiatkowski, S., Sniegula, A., Wieczorek, B. 2020. Passenger BIBO detection with IoT support and machine learning techniques for intelligent transport systems. Procedia Computer Science. 176. 3780-3793. https://doi.org/10.1016/j.procs.2020.09.009
- Mezghani, M. (2008). Study on electronic ticketing in public transport. European Metropolitan Transport Authorities (EMTA), 56, 38.
- NFC Forum. (2016). NFC-enabled e-Ticketing in Public Transport: Clearing the Route to Interoperability. December. https://nfc-forum.org/wp-content/uploads/2016/12/NFC_enabled_eTicketing_in_Public_Transport_White_Paper.pdf
- N.N. (2009). Be-In-Be-Out Payment Systems for Public Transport: Final Report. Department for Transport (London). Available at: https://manualzz.com/download/2984265 [Accessed: 29 July 2022]
- Singh, J. (2021). Payment apps, CiBo, and biometricts: what’s next for mobile ticketing? Intelligent Transport. Available at: https://www.intelligenttransport.com/transport-articles/114876/future-of-mobile-ticketing/ [Accessed: 20 July 2022]
- ÖBB. Ihr Weg zum Ticket. Available at: https://www.oebb.at/de/tickets-kundenkarten/weg-zum-ticket [Accessed: 13 January 2021]
- Turner, M., & Wilson, R. (2010). Smart and integrated ticketing in the UK: Piecing together the jigsaw. Computer Law & Security Review, 26(2), 170-177.
- Wels Linien. Tarife. Available at: https://www.welslinien.at/tarife/ [Accessed: 13 January 2021]
- Wiener Linien. (2021a). Der richtige Fahrschein, der passende Tarif. Available at: https://www.wienerlinien.at/eportal3/ep/channelView.do/pageTypeId/66526/channelId/-46648 [Accessed: 13 January 2021]
- Wiener Linien. (2021b). Digital-Wettbewerb “Vienna Tickethon” gestartet. Available at: https://www.wienerlinien.at/eportal3/ep/contentView.do/pageTypeId/66526/programId/74577/contentTypeId/1001/channelId/-47186/contentId/5002360#:~:text=Im%20Rahmen%20eines%20internationalen%20Hackathon,Wettbewerb%20l%C3%A4uft%20bis%20Anfang%20M%C3%A4rz [Accessed: 13 January 2021]
- Wikipedia contributors. (2021, January 8). List of smart cards. In Wikipedia, The Free Encyclopedia. Available at: https://en.wikipedia.org/w/index.php?title=List_of_smart_cards&oldid=999040130 [Accessed: 13 January 2021]
7.6 Information and assistance for people with special needs
Updated: 6th August 2022
Definition
Vehmas (2010: 92) defines that having a special need “…implies that an individual has the kind of characteristics that it is unlikely, or at least uncertain, whether he or she would achieve the aim that defines the need in question without special instruction, procedures that are out of ordinary.” Special needs can therefore mean a mobility limitation due to age or any type of disability.
Furthermore, “Assistive technology refers to any system, services, appliances or devices that could be used to help disabled people with their daily life by removing some barriers to activities.” (Low et al., 2020).
Because the types of disabilities are diverse and so are the specific needs, Low et al. (2020) argue that more specific measures should be taken to meet the particular needs of specific disabilities rather than generalizing the types of assistive devices available. The requirements regarding traffic systems for people with special needs can be divided into (1) visual impairment, (2) hearing impairment, (3) mobility impairment, and (4) mental impairment. While for some people with special needs only one may be applicable, the elderly people might depend upon more than one or even all.
Low et al. (2020) argue, that especially people with visual impairment (VIP) are dependent on public transport, because they cannot drive vehicles themselves, which leads to a restriction of freedom of movement. The same applies to many people with limited mobility who are excluded from active participation in motorized individual transport. Limited access to travel information is often a barrier to independent travel and other daily activities for people with special needs. When using public transportation, the choice of route is influenced by the reliability and availability of information, as well as convenience and comfort. However simply gathering this information before a trip can often be a problem for VIPs, as a lot of information is printed. However, the current trend towards online materials is helping. Due to physical and mental conditions, especially old or disabled people might need some extra information, for example, many older people cannot stand for long, are sensitive to weather conditions, cannot do things quickly or cannot walk long distances (Hounsell et al., 2016). A lack of usable information can add a negative aspect to the overall experience and actually prevent a trip.
In addition, Low et al. (2020) argue, that bus riding poses several challenges for VIPs, such as finding the right bus, which is especially problematic when multiple bus stops are at the same station. The mix of fleets used makes it difficult for VIPs to identify the characteristics of a bus. Furthermore, it is often difficult for VIPs to locate the boarding point for buses. Regarding trains, the gap between the train and the platform can be a barrier. An important part of public transport are audio announcements, which serve as a source of information for VIPs. If these systems fail, the journey is perceived as particularly stressful.
To overcome barriers at the ticket buying, the implementation of contactless card systems (see Contactless public transport cards section) or free passes for disabled people can help (Low et al., 2020).
Key stakeholders
- Affected: People with special needs, elderly population, care takers
- Responsible: Transport service providers and public transport operators, MaaS operators and integrators, IT system providers, city councils, local, regional and national authorities, public transport associations, industry suppliers, Association for the Blind, Association for the Disabled
Current state of art in research
The study by Low et al. (2020) reflects, among other things, VIPs’ desire to be independent in planning their trips by using online resources rather than seeking help from others. This shows the importance of having appropriate online tools for VIPs. Interviewees mentioned that they need to use many different sources and apps to plan a single trip, which in turn causes a lot of stress and decreases the propensity to the use of public transport. In addition, VIPs were found to lack access to current policies and information on available assistance. Furthermore, it was pointed out, that a similar interior design of buses would be extremely helpful for VIP and increase safety.
Goldberg et al. (2018) looked into the needs of VIPs for orientation, navigation and mobility. Based on their findings, they propose “an integrated cyber-physical system (CPS) framework with ‘Agents’ and ‘Smart Environments’ to address VIP’s ONM needs in urban settings.” Fusco & Coughlan (2020) described “a computer vision approach to indoor localization that runs as a real-time app on a conventional smart-phone, which is intended to support a full-featured wayfinding app in the future that will include turn-by-turn directions.” One advantage of this approach is that no new infrastructure is needed, just a working smartphone with a built-in camera.
Hounsell et al. (2016) addressed information needs of older people particularly using public transport. Among other things, they found that elderly people “may need larger font displays and primary data only, while mobility impaired people may need information on walking distances and the existence of gradient, steps, seats, etc.” By reviewing international cases of open data implementation, they found examples of authorities initiating the market by running competitions to develop apps for targeted groups such as older or disabled people.
Kassens-Noor et al. (2021) studied the effect of autonomous vehicles for people with special needs and found, that along with the potential to increase mobility for these populations they are still not considered in most research. In their survey, they found significant differences among different special needs groups in their willingness to use APT (autonomous public transport). The results, therefore, suggest that people with special needs perceive AVs primarily negatively and need further attention in future research. Other studies researched the adoption of assistive technology among disabled people and show that there is a variability of technology adoption depending on the type of disability (König et al., 2022) but also that the main drivers of the use of assistive technology are the advancement of living standards and enhancement of users’ performance (Salim et al., 2022). Furthermore, a recent study addressed the problem of accessible maps for indoor and outdoor mobility. It proposed making information about buildings available and creating tactile indoor maps and accessible navigation apps which are also adaptable to the users’ needs (Loitsch et al., 2022).
Current state of art in practice
One of the common assistive tools available to VIP are mobility tools, in particular a long cane or a guide dog. GPS is used as an assistive technology for VIP for orientation purposes and as a navigation aid. It can also be integrated into other devices to help VIP with orientation, such as a GPS-based voice alarm system that alerts VIP to nearby obstacles (Low et al., 2020). Additionally, a variety of initiatives and technologies to promote the inclusion of people with special needs creating software that help to give voice to people with communication difficulties (The Open Voice Factory) or researching on smartphone tools to integrate people with intellectual disabilities (Disability Innovation Institute) (Gervais, 2022). BlindSquare is one of the most popular GPS apps in the world for blind and visually impaired people. It describes the surroundings, warns about street intersections and important points as one moves along. Used in conjunction with external free navigation apps, BlindSquare provides almost all the information blind and visually impaired people need to be independent on the road. BlindSquare determines the location using the smartphone’s GPS capabilities and retrieves information about the surrounding area on Foursquare and Open Street Map. Thanks to its unique algorithms, it determines the most relevant information and states it clearly in an artificial voice (BlindSquare., n.d.). A similar app is Seeing Assistant Move, which is based on Google Maps and also works offline and with voice control (Transition Technologies S.A., n.d.). Using public transport audio announcements plays a crucial role in helping VIP to be prepared to alight from the vehicle (Low et al., 2020).
Induction hearing systems or induction hearing loops are used to provide people with hearing problems with auditory information. The principle is based on special cables, the so-called induction loop, which is operated by an induction amplifier that converts the signals coming from the microphone and feeds them into the loop as a current. This current, in turn, creates a weak magnetic field in the coil in the room, which pulses in rhythm with the speech. This weak magnetic field is picked up by the hearing aid’s T-coil, similar to an antenna, and converted back into audible sound vibrations. Almost no background noise is transmitted and the desired information can thus be heard without interference, almost in HIFI quality (Sturma, 2011).
To ensure accessibility for people with limited mobility in buses, more and more cities are focusing on the use of low-floor vehicles that can be lowered further hydraulically if required. The low entrance height makes boarding and alighting much easier, especially for older people and passengers with baby carriages or wheelchair users. Tramway equipment is also constantly being improved. Modern cars have more space for passengers with wheelchairs or baby carriages and a retractable ramp to bridge the already minimized gap between the platform edge and the vehicle (Wiener Linien, n.d.). As in Vienna, for example, real-time displays at stations can use a wheelchair symbol to indicate whether the expected public transport vehicles are barrier-free.
Finally, for example in Singaporean buses were introduced amenities for the convenience of pregnant, elderly and young passengers in the form of designated priority seats, low floors along the entire bus and low steps at the entrance and exit to facilitate individuals with limited mobility to board the bus quickly as well as move along the bus more easily (Smrt.com.sg, 2021).
Impacts with respect to Sustainable Development Goals (SDGs)
| Impact level | Indicator | Impact direction | Goal description and number | Source |
|---|---|---|---|---|
| Individual | Safe access to public transport for people with special needs | + | Health & Wellbeing (3) | Low et al. (2020) |
| Individual | Equal freedom of movement for people with special needs | + | Equality (5,10) | Low et al. (2020) |
| Individual | Improved access to public transport | + | Environmental sustainability (7,12-13,15) | Low et al. (2020) |
| Systemic | Increase in innovative apps developed for targeted groups; use of open data | + | Innovation & Infrastructure (9) | Hounsell et al. (2016) |
Open questions
- How could real-time information be better available for visually impaired people?
- How could audio announcements be improved?
- How to improve staff assistance?
- How could smart technologies become more accessible to older people?
References
- BlindSquare. (n.d.). What is BlindSquare? Available at: March 4, 2021, from https://www.blindsquare.com/about/ [Accessed: 4 March 2021]
- Fusco, G., & Coughlan, J. M. (2020, April). Indoor localization for visually impaired travelers using computer vision on a smartphone. In Proceedings of the 17th International Web for All Conference (pp. 1-11).
- Gervais, Z. (2021). Disability as an Innovation Driver for the Smart City. Inclusive City Maker. Available at: https://www.inclusivecitymaker.com/disability-innovation-driver-smart-city/ [Accessed: 1 August 2022]
- Goldberg, M., Zhu, Z., & Zhang, Z. (2018). How do we aid visually impaired people safely manage unfamiliar environments?.
- Hounsell, N. B., Shrestha, B. P., McDonald, M., & Wong, A. (2016). Open data and the needs of older people for public transport information. Transportation research procedia, 14, 4334-4343.
- Kassens-Noor, E., Cai M., Kotval-Karmchandani, Z., Decaminda, T. (2021). Autonomous vehicles and mobility for people with special needs. Transportation Research Part A. 150, 385-397. https://doi.org/10.1016/j.tra.2021.06.014
- König, A., Alciauskaite, L., Hatzakis, T. (2022). The Impact of Subjective Technology Adaptivity on the Willingness of Persons with Disabilities to Use Emerging Assistive Technologies: A European Persepective. International Conference on Computers Helping People with Special Needs. ICCHP-AAATE 2022, pp 207-214. Available at: https://link.springer.com/chapter/10.1007/978-3-031-08648-9_24 [Accessed: 31 July 2022]
- Loitsch, C., Müller, K., Weber, G., Petrie, H., Stiefelhagen, R. (2022). Digital Solutions for Inclusive Mobility: Solutions and Accessible Maps for Indoor and Outdoor Mobility. International Conference on Computers Helping People with Special Needs. 95-101. DOI: 10.1007/978-3-031-08648-9_12
- Low, W. Y., Cao, M., De Vos, J., & Hickman, R. (2020). The journey experience of visually impaired people on public transport in London. Transport Policy, 97, 137-148.
- Smrt.com.sg. (2021). Accessibility. Smrt.com.sg. Available at: https://www.smrt.com.sg/Journey-with-Us/SMRT-Buses/Accessibility [Accessed: 12 March 2021].
- Sturma, A. (2011). Höranlagen. https://www.oessh.or.at/hoerspuren/hoeranlagen
- Transition Technologies S.A. (n.d.). Seeing Assistant Move - Features. Available at: http://seeingassistant.tt.com.pl/move/ [Accessed: 4 March 2021]
- Vehmas, S. (2010). Special needs: a philosophical analysis. International journal of inclusive education, 14(1), 87-96.
- Wiener Linien. (n.d.). Barrierefreiheit bei den Wiener Linien - Wiener Linien. Available at: https://www.wienerlinien.at/web/wiener-linien/barrierefreiheit [Accessed: 16 March 2021]
7.7 Mobility hubs
Updated: 6th August 2022
Synonyms
Mobility station or point, mobihub, (public) ride point, smart station, sharing zone, transportation center, public transit or transport hub, transport interchange, ride port, share point, intermodal hubs
Definition
There are many different definitions of mobility hubs. In general, mobility hubs are places to change transport mode. However, they can also be much more than that and are essential for the functioning of Mobility as a Service (See MaaS). Mobility hubs are expected to be convenient and safe for switching modes, but they could also close supply gaps, enhance traveller experience and the quality of life in a certain area (Clemens, 2020). Airports, train and subway stations usually include car park and car rental, bus stops and taxi stands as well as restaurants, shops, hotels or even conference centres, which benefit from passing trade and goods accessibility. They represent so-called “naturally” grown mega hubs (Clemens, 2020). In addition, municipalities around the world are systematically planning and implementing further mobility hubs that vary in size - from a small bus stop with an attached bike sharing station to a mega hub as described above. They are supposed to improve intermodal mobility and bring socio-economic benefits (Clemens, 2020). Specific names and strong visual branding are designed to help passengers recognize them quickly.
Mobility as a Service or Mobility on Demand concepts are designed to make it possible to not own a car and still be mobile. Mobility hubs should offer the greatest possible variation of means of transport for individual route chains and thus, ensure that car journeys are not all replaced one-to-one by car sharing journeys, but that the transport routes are covered as sustainably as possible (Clemens, 2020). Since each additional transfer during a trip creates a barrier and tempts people to use private motorized transport instead, the goal of mobility hubs is to provide these transfers with a benefit and to ensure that the transfer runs smoothly. Examples include allowing people to work or relax, pick up a package, meet friends, or do necessary shopping during their commute home (Clemens, 2020). Mobility hubs could also be combined with quarter logistics hubs (See Urban deliveries) (Herrmann, n.d.).
Key stakeholders
- Affected: Public and private transport users, Commuters
- Responsible: City administration, Public transport operators, Mobility service providers, District authorities, Private companies, Shared mobility providers
Current state of art in research
Bell (2019) has analysed the user requirements of mobility hubs. He argues that mobility hubs or intermodal hubs differ depending on the area in which they are implemented, e.g. rural or urban areas, and that success and sustainability strongly depend on the particular design. An overview of his general conclusion is shown in Figure 7.2.
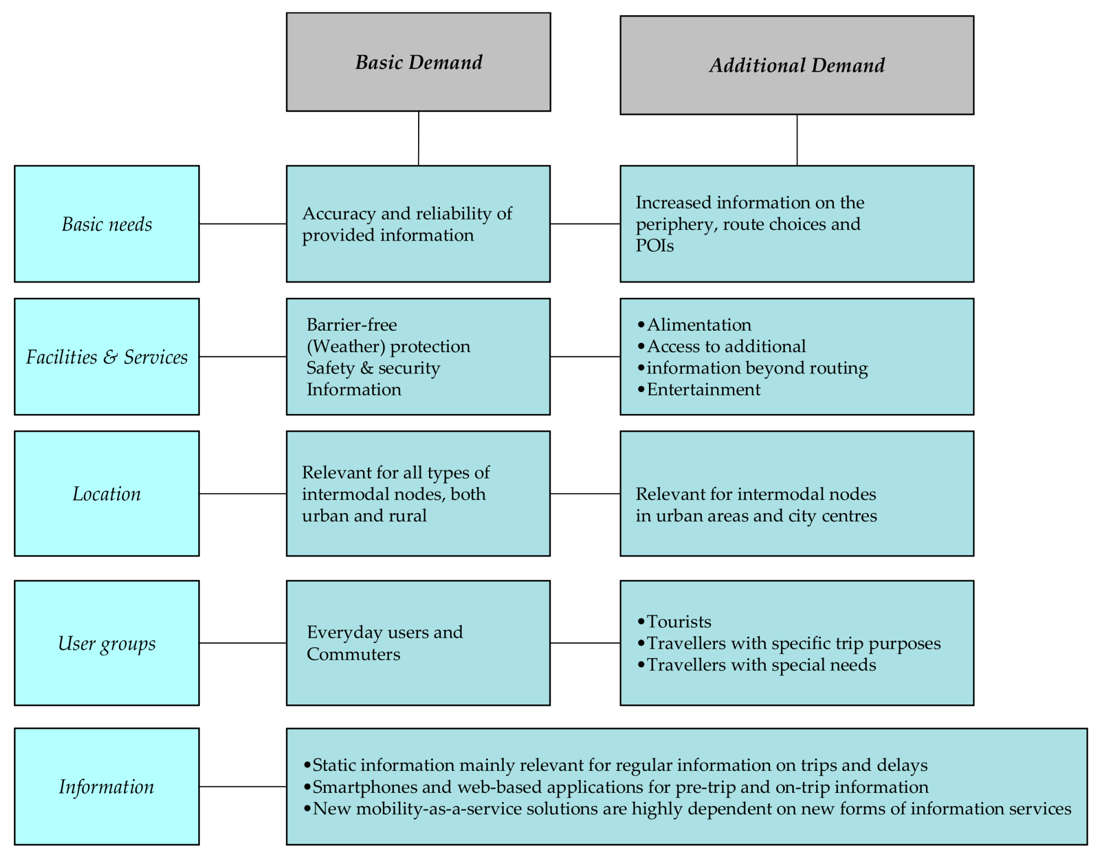
Figure 7.6: : User requirements at public transport stops (Bell, 2019)
Based on research conducted in American cities, Hochmair (2015) argues, that it is recommended to ensure improved cycling infrastructure, such as bike-sharing stations, within a 1-mile radius for bus-only stations and within 2 miles for train stations.
Tran & Draeger (2021) have presented a new evaluation framework and algorithm to locate and assess the sustainability and equity impacts of nodes in cities. Investment strategies for nodes are evaluated based on (1) current mode split, (2) high transit capacity, and (3) multimodal services. From an equity perspective, high transit capacity and multimodal node strategies include more low-income areas than the current mode split, which primarily covers middle-income areas. The results of the study show how municipalities can strategically invest in public transit and multimodal options to increase frequency, quality and overall mobility for low- and moderate-income households and improve access to key facilities for more vulnerable citizens. Municipalities can use the assessment framework to explore alternative transport investment scenarios. This should make it possible to spatially locate urban hubs to meet future transport demand, increase the uptake of multimodal services and improve equal access for all citizens. A methodology by Blad (2021), to determine the potential of areas for regional mobility hubs was conducted and tested in the city of Rotterdam. It consists of five criteria (potential demand, costs, generalized travel costs, link to surroundings and impact) which are measured by nine attributes and shows suitability to tackle the location potential determination problem.
Franken (2021) investigated the potential of mobility hubs to reduce car use and car ownership and also how these are influenced by the characteristics of the car owner, the characteristics of the trip and the characteristics of the car owner’s living environment. His results showed that the operating costs of shared mobility services and walking distances to mobility hubs are important determinants of the use of shared mobility services, with higher sensitivity to operating costs for the shared e-car than for shared e-mopeds and e-bikes. Furthermore, he found that the density of mobility hubs in a residential area has a strong impact on reducing car use and car ownership. This matches with the fact that the impact of mobility hubs on car use and car ownership was highest in the city center, followed by a suburban area and lowest in a rural area.
In 2018, MA 18 - Urban Development and Planning and MA 21 - District Planning and Land Use of the City of Vienna published a guideline for the implementation of mobility stations in urban development areas (Stadt Wien - Stadtentwicklung und Stadtplanung (MA 18) & Stadtteilplanung und Flächennutzung (MA 21), 2018). On behalf of the German Federal Ministry for the Environment, Nature Conservation and Nuclear Safety (BMU), also the German Institute of Urban Affairs (Deutsches Institut für Urbanistik) published a report in 2019 on the findings and experiences on mobility stations in municipal practice (Stein & Bauer, 2019).
ETH Zurich (Wicki et al., 2022) conducted a survey in three cities that aimed to identify social requirements. They found that the most important feature of mobility hub is the offer of different mobility systems, while the second most important is its contribution to the open space (as a part of identity in a social setting). Nonetheless, there is a general lack of knowledge and awareness for micro mobility (especially e-scooters) and its last mile coverage was mostly highly criticised. Missing social acceptance can be seen as a main contributor to slower adoption of mobility hubs. Researchers, therefore, suggest to identify the needs of users and raise awareness and knowledge in this area.
Current state of art in practice
In order to promote both the health and quality of life of citizens, while improving sustainability and accessibility in transportation within cities, six partner cities from five different countries have committed to establish so-called e-Mobility Hubs, in short eHUBS. eHUBS are on-street locations that bring together e-bikes, e-cargo bikes, e-scooters and/or e-cars, offering users a wide range of options to experiment with and use in different situations. These dedicated on-street locations, where citizens can choose from a variety of sustainable electric transportation options for shared use, are intended to provide a true alternative to private car use by offering opportunities to increase shared and electric mobility in a truly innovative way. Hubs can vary in size (minimalist, light, medium, large), type of location, and type of service. They can be small and located in residential areas, with only one or two parking spaces, or larger and positioned near train stations and major public transit hubs, but ultimately the key is that they should always be where supply and demand meet. The knowledge and experience gained will, then help other cities and regions get close and consistently tackle air pollution, congestion and CO2 emissions, and create a growing market for commercial e-mobility providers (Interreg North-West Europe (NWE), 2019).
In Vienna, there are already 8 so-called “WienMobil Stations” operated by Wiener Linien, which combine access to public transport with various services and sharing offers. They vary by station, but can include bike sharing, scooter sharing, moped sharing, car sharing, bike service station, cab, e-charging station, bike storage boxes, cargo bikes (Wiener Linien, 2021).
Beyond, in the cities of Graz and Linz and the Styrian Central Region, mobility hubs called “tim” have been implemented. They combine public transport stations with (e-)car sharing, call-collection taxis, bicycle parking facilities and rentable cargo bikes (see tim-oesterreich). Additionally, the small city of Weiz (close to Graz) implemented smart mobility and two new mobility hubs in 2022 including e-car sharing, WASTI (a called and shared cab) and WeizBike (Interreg Central Europe (CE), 2022).
In the Netherlands, too, there are already several Mobility hubs of various types. One example is the hub P+R Gieten, which is located at the transport hub Gieten and has a fast connection to Groningen, Veendam, Stadskanaal, Emmen and Assen via the N33 and N34. The hub allows a transfer between Qliners and regional buses and is the main bus stop for the villages of Gieten and Eext. At this hub there are two free parking facilities, a spacious covered bike shed, lockers and a kiosk, a wheelchair accessible toilet and outdoor fitness equipment. Also, there are two types of bicycle lockers. Boxes that can be opened with a key and boxes that can be reserved and opened with an app (Reisviahub.nl, n.d.).
Impacts with respect to Sustainable Development Goals (SDGs)
| Impact level | Indicator | Impact direction | Goal description and number | Source |
|---|---|---|---|---|
| Individual | Improved accessibility | + | Equality (5,10) | Miramontes et al., (2017) |
| Individual | Increased multimodal trips | + | Sustainable economic development (8,11) | Miramontes et al., (2017) |
| Systemic | Reduced car use and car ownership | + | Environmental sustainability (7,12-13,15) | Mosshammer, (2020); Franken, (2021) |
| Systemic | Creation of new nodes and upgrading of existing transport infrastructure | + | Innovation & Infrastructure (9) | Reisviahub.nl, n.d.;Wiener Linien, 2021 |
Open questions
- How to ensure that the construction of mobility hubs does not drive up the housing prices of an area?
- How to ensure the best user experience?
- How to prevent vandalism in mobility hubs?
References
- Bell, D. (2019). Intermodal Mobility Hubs and User Needs. Social Sciences, 8(2), 65.
- Blad, K. (2021). Developing a methodology to determine the potential of areas for regional mobility hubs. Delft University of Technology – Transport, Infrastructure and Logistics. Available at: https://repository.tudelft.nl/islandora/object/uuid%3A4f2d801f-74fd-4cc1-bfe9-b5f0793b2976. https://doi.org/10.3929/ethz-b-000549806 [Accessed: 7 August 2022].
- Clemens. (2020, November 24). Mobility as a Service (MaaS) - Mobility Hubs. https://mobility-as-a-service.blog/mobility-hubs/
- Franken, M. (2021). Effects of e-mobility hubs in residential areas on car use and ownership: Stated choice experiments in the context of Dutch cities.
- Herrmann, F. (n.d.). Intermodal Urban Mobility Systems. Available at: https://www.morgenstadt.de/de/innovationsfelder/intermodal_urban_mobility_systems.html [Accessed: 6 May 2021]
- Hochmair, H. H. (2015). Assessment of bicycle service areas around transit stations. International journal of sustainable transportation, 9(1), 15-29.
- Interreg North-West Europe (NWE). (2019, October 3). eHUBS - Smart Shared Green Mobility Hubs | Interreg NWE. https://www.nweurope.eu/projects/project-search/ehubs-smart-shared-green-mobility-hubs/
- Interreg Central Europe (CE). (2022). Smart Mobility and Mobility Hubs – Good Practice in the Small City of Weiz. Innovationszentrumg W.E.I.Z. Available at: https://www.interreg-central.eu/Content.Node/PROSPECT2030/Smart-Mobility-and-Mobility-Hubs-Good-Practice-in-Weiz.pdf [Accessed: 1 August 2022]
- Miramontes, M., Pfertner, M., Rayaprolu, H. S., Schreiner, M., & Wulfhorst, G. (2017). Impacts of a multimodal mobility service on travel behavior and preferences: user insights from Munich’s first Mobility Station. Transportation, 44(6), 1325-1342.
- Mosshammer, L. (2020, October 27). Sharing and new forms of mobility: social, environmentally friendly, efficient. https://www.austriatech.at/en/sharing-and-new-forms-of-mobility/
- Reisviahub.nl. (n.d.). Gieten (N33 / N34) . Available at: https://www.reisviahub.nl/hubs/gieten-ov-knooppunt-n33-n34/ [Accessed: 6 May 2021]
- Stadt Wien - Stadtentwicklung und Stadtplanung (MA 18) und Stadtteilplanung und Flächennutzung (MA 21). (2018). Leitfaden Mobilitätsstationen: Die Umsetzung von Mobilitätsstationen in Stadtentwicklungsgebieten am Beispiel Zielgebiet Donaufeld, Wien.
- Stein, T., & Bauer, U. (2019). Mobilitätsstationen in der kommunalen Praxis, Erkenntnisse und Erfahrungen aus dem BMU-Forschungsprojekt City2Share und weiteren kommunalen Praxisbeispielen. http://www.difu.de
- Tran, M., & Draeger, C. (2021). A data-driven complex network approach for planning sustainable and inclusive urban mobility hubs and services. Environment and Planning B: Urban Analytics and City Science, 2399808320987093.
- Wicki, M., Hauller, S., Kaufmann, D., Bernauer, T. (2022). Co-Creating Mobility Hubs (CCMH) – Ein transdisziplin#res Forschungsprojekt der SBB zusammen mit der ETH Zürich und der EPF Lausanne: Resultate der Umfrage zu gesellschaftlichen Anforderungen. Available at: https://ethz.ch/content/dam/ethz/special-interest/dual/istp-dam/documents/ISTP/Research/co-creating-mobility-hubs/220601_CCMH_Ergebnisse_Umfrage.pdf [Accessed: 7 August 2022]
- Wiener Linien. (2021). WienMobil Stationen - Wiener Linien. Available at: https://www.wienerlinien.at/web/wiener-linien/wienmobil-stationen [Accessed: 6 May 2021]
7.8 Rail telematics for passengers and freight
Updated: 16th August 2022
Synonyms
Telematics Applications for Freight services (TAF), Telematics Applications for Passenger services (TAP), Technical Specification for Interoperability (TSI)
Definition
With increasing digitalisation and automation in rail operations, many applications are being developed that will make it possible to significantly increase the attractiveness and efficiency of rail transport. Telematics applications are a functional subsystem of the railway that comprises two elements (European Commission, 2021):
- applications for freight services, including information systems (real-time monitoring of freight and trains), marshalling and allocation systems, reservation, payment and invoicing systems, management of connections with other modes of transport and production of electronic accompanying documents
- applications for passenger services, including systems providing passengers with information before and during the journey, reservation and payment systems, luggage management and management of connections between trains and with other modes of transport
Telematics applications provide permanent interfaces and a constant dialogue between the train and the infrastructure at all stages of the process. The exchange of information between the infrastructure manager (IM) and the railway undertakings (RU) is essential for the success of telematics. The IMs modify and implement new IT tools to adapt the legacy systems to the requirements of the telematics applications TAF-TAP. The IT strategies and implementation plans of the IMs are, therefore, aligned with the requirements of the EU Railway Agency (ERA). As more stakeholders are involved in the use of telematics, they also define strategies, priorities and mandatory requirements taking into account the broader IT system landscape. In addition, IMs collect millions of data every day and invest in digitalisation to improve predictive maintenance of fixed assets and optimise the performance of their network. After all, efficient use of data could increase infrastructure capacities. Telematics applications will improve incident management (service interruptions), terminal operations such as shunting and intermodal operations, thus reducing operating costs (EIM, 2019).
Further, the basis for a smart and connected freight wagon is, in addition to telematics for geolocation and communication (satellite navigation, inertial and mobile radio systems), the use of sensors for condition recording and intelligent validation of driving and operating conditions (Ußler et al., 2019). In road transport, about 85% of trucks are equipped with telematics systems that monitor the condition of the vehicle, track its position and provide a direct communication with the driver via mobile phone. Fleet management receives real-time information and has redundant ways to communicate with the transport in case of problems. Rail freight traditionally operates its transports with infrastructure-based information sources. Therefore, wagons are usually not equipped with wagon-based monitoring and communication devices such as telematics systems and sensors. The result is a constant loss of time-critical goods to road transport (Behrends et al., 2016).
Key stakeholders
- Affected: Mobile citizen, delivery companies and truck drivers, customers of online shops
- Responsible: National governments, private companies, public rail provider
Current state of art in research
Single wagonload transport (SWL) that refers to a situation where individual wagons or groups of wagons from different consignors are bundled together to form one train, is an important component in the European rail transport system and in the logistics of various industries such as steel, chemicals and automotive. However, changing framework conditions and increasingly demanding market requirements have led to dramatic losses of market share and in some countries even to the complete discontinuation of the SWL business. As this business segment is also seen as an important part of the European co-modal transport system in the future, significant improvements are necessary.
With on-board communication technology, freight operators can improve wagon dispatching and rescheduling processes in case of disruptions. Based on reliable online telematics data, dispatchers will be able to inform their customers about changes in the transport plan earlier, which will increase reliability and satisfaction of stakeholders (Zoric et al., 2021).
Cost-efficient and intelligent telematics-based information services allow wagons to be tracked in real time and automatically present wagon mileage information. The telematics data service generates the necessary information required for reliable quality recording. This additional information optimises the current six-year life cycle of freight wagons.
With respect to passenger services, Müller et al., (2020) investigate the effect of unexpected disruptions and information times on public transport passengers. It is demonstrated that transport operators can minimize the negative impact of unplanned disruptions by informing their passengers as soon as possible once the disruption has occurred, because travel times increase drastically when passengers are informed too late. For more information see also chapter on passenger information systems, where it has been showed that the real-time and accurate information displayed to passengers on various devices for precise information are essential items for efficiency and convenience (Zoric et al., 2021)
Current state of art in practice
A group of freight rail industry stakeholders in the US announced the formation of Rail Pulse, a joint venture in late 2020 to create a technology platform which will facilitate and accelerate the adoption of GPS and other telematics technologies in the North American railcar fleet. Rail Pulse partners are focused on promoting the adoption of telematics on two fronts:
- Rail safety, with the early phase of the platform focused on handbrake and impact data, which they believe could provide important safety data points for railways, car owners and shippers, coupled with a forward-looking approach to telematic features such as on-board bearing temperature and wheel impact detection sensors;
- Improve the competitive position of rail compared to other modes by improving visibility of the status, location and condition of individual wagons, with telematic capabilities including data collection to support real-time track-level visibility of whether doors or hatches are open, whether the wagon is loaded or partially loaded and other key performance indicators.
Development of the Rail Pulse platform was expected to begin by the end of 2020, with a full service platform available to the North American railcar industry by the end of 2022 (Berman, 2020; Luczak, 2021).
An investment in wagon telematics results in lower costs and higher turnover. One of the critical indications for a large implementation of telematics seems to be the fact that all three parties - shippers, railways and wagon keepers - will share the benefit of “lower costs”. But this distribution of benefits may also lead to a “wait and see” behaviour of many railway stakeholders compared to their competitors on the road (Behrends et al., 2016).
Siemens (2018), equipped the DB Cargo AG (German Railways) with CTmobile, a sensor technology that allows to detect each wagon directly and continuously, while providing information on load condition (Siemens, 2022). In Austria, the ÖBB (Austrias Federal Railways), began their smartCargo project in 2019 with A1 and A1 digital. Telematics provide position and impact detection as well as sense motion. The newest standards include 3D acceleration sensors, a sensor to provide exact GPS coordinates. 11.000 freight wagons have already been equipped with this technology (Allan, 2022).
Thus far, a significant cost reduction was achieved with new GSM and GPS modules. Interfaces for supplementary sensors such as impact detection, digital/analogue inputs/outputs, etc. were integrated. Furthermore, based on the analysis of user requirements, the development of a reliable load-sensing technology for freight wagons was started. This requirement emerged from the fact that today most freight wagons in railway operation do not use their full load capacity, as there is no cost-effective way to measure the load, especially during the filling process, e.g. in the area of bulk goods. If the wagons were to be overloaded and then moved by a train, all wheelsets would have to be replaced during costly inspection in a workshop. As a result, the freight wagon is not filled to its maximum payload, which leads to lower capacity and higher costs. To optimise the dispatching processes, the wagons transmit their loading status so that the dispatchers can re-dispatch the wagon in a short time after unloading, resulting in shorter downtimes and higher efficiency of the wagons (Behrends et al., 2016).
Regarding rail telematics for passenger services, Victoria (Australia) is introducing a real-time crowded train tool. Commuters travelling on Melbourne’s rail network can now see in advance how crowded selected stations and trains are thanks to a new online tool called RideSpace. However, the data collected by the passenger counting sensors and predictive modelling technology has yet to be made available to third parties so they could use it in their journey planning apps. The tool displays current and predicted levels of “train, station and platform occupancy” on city lines, using symbols that range from “very quiet to very full”. Similar technology is already being used in NSW to show real-time seat availability on Waratah trains so passengers can pre-empt potential overcrowding. The tool was developed by NTT Data and Telstra Purple and uses unspecified data modelling and machine learning for real-time estimates of overcrowding. The tool is part of a two-pronged attempt by the government to get Melbourne residents back on public transport after last year’s deadly Covid 19 outbreak. The government is also offering commuters a 30% discount on off-peak fares for three months. It is expected that the tool’s capacity data will soon be made available to third-party travel planning apps, although the government did not indicate when this would happen. Public Transport Minister Ben Carrol said that the tool puts the information Victorians need to make smart travel decisions directly into their hands (Hendry, 2021).
Impacts with respect to Sustainable Development Goals (SDGs)
| Impact level | Indicator | Impact direction | Goal description and number | Source |
|---|---|---|---|---|
| Systemic | Rail safety and comfort improved | + | Health & Wellbeing (3) | Berman, 2020; Hendry, 2021 |
| Systemic | Potential for lower costs for all involved parties | + | Sustainable economic development (8,11) | Behrends et al., 2016 |
| Systemic | Digitalisation implemented | + | Innovation & Infrastructure (9) | Behrends et al., 2016 |
| Systemic | Possibility for wait and see behaviour | - | Partnership & collaborations (17) | Behrends et al., 2016 |
Open questions
- What are the barriers that prevent the implementation of digital solutions?
- What should be changed to enable an effective use of digital solutions?
References
- Allan, K. (2022). ÖBB Rail Cargo Group (RCG) has now put its 11.000th smart freight wagon on the rails. Available at: https://railway-news.com/obb-rail-cargo-group-rolls-out-11000th-intelligent-freight-wagon/ [Accessed: 14 August 2022]
- Behrends, V., Haunschild, M., & Galonske, N. (2016). Smart Telematics Enabling Efficient Rail Transport - Development of the ViWaS Research and Development Project. Transportation Research Procedia, 14, 4430–4439. https://doi.org/10.1016/j.trpro.2016.05.365
- Berman, J. (2020, October 22). Freight rail offering aims to boost GPS and telematics adoption across North American railcar fleet - Logistics Management. https://www.logisticsmgmt.com/article/freight_rail_offering_aims_to_boost_gps_and_telematics_adoption_across_nort
- EIM (2019) Telematics application for Freight and Passengers - EIM. Available at: https://eimrail.org/document/telematics-application-for-freight-and-passengers/ [Accessed: 15 April 2021].
- European Commission. (2021). Telematic applications | Mobility and Transport. https://ec.europa.eu/transport/modes/rail/interoperability/interoperability/telematic_applications_de
- Hendry, J. (2021) Victoria launches real-time crowding tool for trains - Hardware - Software - iTnews. Available at: https://www.itnews.com.au/news/victoria-launches-real-time-crowding-tool-for-trains-560504 [Accessed: 15 April 2021].
- Luczak, M. (2021). RailPlus Moves Forward on Telematics Plattform. Available at: https://www.railwayage.com/analytics/railpulse-moves-forward-on-telematics-platform/ [Accessed: 13 August 2022]
- Müller, S. A., Leich, G. and Nagel, K. (2020) ‘The effect of unexpected disruptions and information times on public transport passengers: A simulation study’, Procedia Computer Science. Elsevier B.V., 170, pp. 745–750. doi: 10.1016/j.procs.2020.03.161.
- Siemens (2018). Siemens stattet güterwagenflotte von DB Cargo mit Sensortechnik und Telematiksytem aus. Available at: https://bahnblogstelle.com/51976/siemens-stattet-gueterwagenflotte-von-db-cargo-mit-sensortechnik-und-telematiksystem-aus/ [Accessed: 13 August 2022]
- Siemens (2022). Let your freight cars talk to you where they are. Available at: https://www.mobility.siemens.com/global/en/portfolio/rail/automation/telematic-systems.html [Accessed: 13 August 2022]
- Ußler, H., Michler, O., & Löffler, G. (2019). Validation of multiple sensor systems based on a telematics platform for intelligent freight wagons. Transportation Research Procedia, 37(September 2018), 187–194. https://doi.org/10.1016/j.trpro.2018.12.182
- Zoric, P., Mikulcic, M., Musa, M., Kuljanic, T. M. (2021). Analysis of Available Information and Communication Solutions and Services for Railway Passenger Information in the EU. EAI International Conference on Management of Manifacturing Systems. DOI: 10.1007/978-3-030-67241-6_29. Available at: https://link.springer.com/chapter/10.1007/978-3-030-67241-6_29 [Accessed: 12 August 2022]