12 Big data
12.1 Wireless communication systems in transport
Updated: 19th September 2022
Synonyms
Floating Car Data (FCD), Dedicated Short-Range Communications (DSRC/ITS-G5 in Europe), Vehicle-to-x (car and infrastructure) (C2x/V2x), Cellular-V2X technology (C-V2X), Vehicular ad hoc network (VANET)
Definition
From 1G to 6G, the meaning of the mobile radio standards (year of introduction, bandwith download) (Techbook, 2020):
- 1G: Mobile telephony in the first generation still worked with analogue voice transmission.
- 2G (up to 14.4 kbit/s): Digital voice transmission in the D-network (1992) with the GSM standard.
- 2.5G, GPRS (2001, up to 55 kbit/s): Digital data transmission.
- 2.75G, EDGE (2006, up to 150 kbit/s.): Further development of GSM by using a more efficient modulation method. The first iPhone used EDGE.
- 3G, UMTS (2004, up to 384 kbit/s): This mobile radio standard enables the simultaneous transmission and reception of several data streams by means of a new radio access technology.
- 3.5G, HSPA (2006, up to 42 Mbit/s): Extension of UMTS.
- LTE (2010, up to 50 Mbit/s): Standard based on the UMTS infrastructure.
- 4G, LTE Advanced (2014, up to 300 to 400 Mbit/s): Latency times have been reduced and radio capacities increased.
- 5G (2020, up to 100 Gbit/s, but the fastest speed measured so far is 1.8 Gbit/s): The latest mobile radio standard with very low latency for real-time responses. But 5G is not so easy to retrofit to existing cell towers, as the waves are very compressed and are between 1 and 10 millimetres long (previous cellular waves are several centimetres long). Frequencies between 6 and 300 gigahertz (GHz) are used to relieve the current network. By comparison, today’s mobile phone network operates in the spectrum between 0.8 and 2.6 GHz. However, the higher frequencies and shorter waves have the disadvantage that walls and obstacles can no longer be penetrated as easily. The radio cells must therefore be arranged more closely meshed. For fast response times of less than a millisecond, more antennas per cell than subscribers are needed. In some countries, including Germany, coverage with 5G has already begun. Critics, however, fear higher radiation exposure from 5G and thus health effects that are not yet calculable.
- 6G (under research, measurements of up to 1Tbps): is expected to be the successor to 5G cellular technology. It is anticipated that 6G networks will be able to use higher frequencies than 5G which enables higher data rates and greater overall capacity (a much lower latency will thereby also be a requirement) (Pawan et al., 2022).
Two major standards for vehicular communications, in the allocated 5.9 GHz frequency band, have developed in recent years (Figure 12.1). One is the Dedicated Short-Range Communications (DSRC) protocol developed in the USA, and another one is the Intelligent Transportation System (ITS) G5 protocol developed by the European Telecommunications Standards Institute (ETSI). These standards are based on the IEEE 802.11p access layer, which was developed for vehicular networks (Mannoni et al., 2019). DSCR (IEEE 802.11p) is referred to as ITS-G5 in Europe, which has been well researched for 20 years and has reached sufficient technical maturity for current use. Despite the 2011 recommendation to use the IEEE 802.11p protocol as the standard for vehicular communications (IEEE, 2014), in recent years many researchers and industrial companies have considered the use of the LTE cellular network as an alternative solution for vehicular networking applications, especially for the transport of Floating Car Data FCD message streams (Salvo et al., 2017). But even though Cellular vehicle to everything (C-V2X) is a rather new technology, it is based on the 3rd Generation Partnership Project (3GPP) family of standards that are successfully deployed in almost all parts of the world (Sattiraju et al., 2020) (first trials in late 2017 (Fillenberg, 2017)).
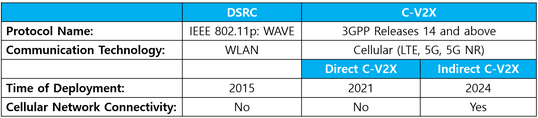
Figure 12.1: DSRC and C-V2X (Autocrypt, 2021)
The term “cellular” in C-V2X can cause some confusion. “Cellular” in this context does not refer to the use of cellular networks, but to the use of the underlying electronics in cellular radios that are adapted to communicate directly from one radio to another. According to (Gettman, 2020), the following are the main similarities and differences between DSRC and C-V2X technology:
Similarities
- Both DSRC and C-V2X use the 5.9 Ghz band to communicate directly from one radio to another.
- Both technologies use the same message sets (SAE J2735 and J2945) and use cases.
- Both technologies use digital signatures to ensure security and trust in message providers.
- In both cases, there is no link between radios. Each radio broadcasts the vehicle’s location, speed, acceleration and other status elements while listening to other radios.
Differences
- DSRC uses a radio standard called WAVE, while C-V2X uses Long-Term Evolution (LTE) - the chip technology that almost all mobile phones use. A DSRC radio cannot talk to a C-V2X radio, and vice versa.
- The range of DSRC is typically 300 m, and many installations have shown that a much higher range is possible. Initial tests of C-V2X show that the range is 20-30% greater than DSRC and that performance in obstacles can be significantly improved. While C-V2X appears to have better performance initially, the range and reliability of DSRC is more than sufficient for the most important security applications.
Also relevant for wireless communications in the transport sector is VANET, a vehicular ad hoc network. It is a subclass of mobile ad hoc networks (MANETs), whereby it is developed by moving vehicles. VANET is increasingly known in the management of rush hour traffic congestion. The biggest challenge in VANET is the cooperation between nodes. In fact, even the best steering convention would not be beneficial if the hubs do not participate in sending the information (Rath et al., 2019).
Key stakeholders
- Affected: Passenger vehicles drivers, Commercial vehicles drivers, Insurers
- Responsible: National Governments, Technology companies, Car manufacturers, Infrastructure manufacturers
Current state of art in research
Long before the creation of 5G, V2X communication was studied. Many analysts and people in the industry expect 5G to be the future technology for V2X communication due to the new speeds and other technical advances in 5G. Consequently, the security of 5G and how it can be integrated into the current ITS model needs to be studied extensively (Annu et al., 2021).
Some research investigates different materials and their properties for wireless communication (Nitika et al., 2021). There is also already some research being done on 6G antenna specifications for the next generation. The terahertz (THz) frequency band (0.1 - 10 THz) will be used in the 6G wireless communications system to support user demand for higher data rates and ultra-high-speed communications for many future applications (Hajiyat et al., 2021). Further, Zhao et al. (2019) are testing a DSRC-based collision warning system because the accuracy of GPS is slightly affected by the driving environment, especially when shielded. Multi-sensor fusion positioning technology is a promising method to improve the accuracy of safety distance calculation and achieve lane-accurate positioning.
Mannoni et al. (2019) compared TS-G5 and C-V2X for the V2X Communication Systems. C-V2X was showed to have better flexibility and performance than ITS-G5 at the same data rate. Based on the performance of the physical layer, the behaviour of both standards was evaluated in a network without mobile coverage and with multiple vehicles. Simulations showed that C-V2X performs better than ITS-G5 when the density of user is low. However, the performance of C-V2X deteriorates more than that of ITS-G5 when the level of congestion increases. The comparison of resource access time (latency) shows an advantage for ITS-G5, but the overall latency is not clearly better as it strongly depends on user density and coverage.
Findings of Sattiraju et al. (2020) also show that C-V2X outperforms IEEE 802.11p DSRC (ITS-G5) technology for almost all of the channel models considered, with a gain of 0-5 dB. Furthermore, the results show that C-V2X performs better at higher vehicular speeds. This better performance of C-V2X can be attributed to the use of the turbo encoder and the better channel estimation mechanism that uses a higher number of DMRS symbols.
Salvo et al. (2017) research on Heterogeneous cellular and DSRC networking for Floating Car Data collection in urban areas showed that it is reasonable to rely on direct V2V communication links (ITS-5G) before sending data over LTE channels (C-V2X). Their proposed solution fully adapts to the available penetration rate of VANET equipment; it automatically falls back to LTE-only FCD collection if VANET equipment is unavailable or too sparse. The achievable throughput of FCD collection is a key issue given the enormous amount of sensor data that can potentially be obtained from moving vehicles, e.g. up to 100 Mbit/s can be transmitted on a vehicle’s CAN bus (Kang et al., 2016). This extreme real-time and high-resolution Big Data requires new ideas for distributed processing and networking to pave the way for smart applications - a trend that has been little explored (Salvo et al., 2017).
Recent studies introduce the 6G communication network. Current key technologies in the Internet of Things (IoT) for energy efficient 6G wireless communication in smart cities are quantum communication, blockchain, visible light communication (VLC), 6G brain-computer interface (BCI) and symbiotic radio. The trend of using 6G in IoT devices is promising (Pawan et al., 2022; Kamruzzaman, 2022).
Current state of art in practice
In Europe DSRC is the main technology currently in use. For example, in 2019, VW launched its Golf 8 with DSRC-based V2X. It made Europe’s most popular car the first mass-market vehicle with V2X. In other parts of the world, after some large-scale field testing, DSRC-based V2X went into production in selected vehicle models in Japan in 2015 and in the US in 2017. While DSRC-based V2X is deployed in Europe and Japan, C-V2X is gaining momentum in other regions. China, for example, is driving the adoption of C-V2X. In early 2020, Autotalk’s chipset was selected for a mass production C-V2X programme in China (Autotalks Ltd., n.d.).
DSRC and C-V2X run on different communication technologies and the access layer is not interoperable. This leaves car manufacturers and infrastructure developers with the difficult decision of whether to favour one technology or the other. However, many chip manufacturers are working on producing dual-mode chipsets that are compatible with both standards, making the switch easier for car manufacturers. As for infrastructure developers, many of them are working with existing DSRC infrastructures to add cellular network connectivity by combining them with indirect C-V2X. Regardless of the communication technologies used, cyber security is an integral part of V2X. AutoCrypt V2X is a security solution that embeds itself into V2X chipsets and protects the V2X system with both authentication and data encryption technologies (Autocrypt, 2021).
According to Erhart (2019) mobile radio (3G/4G, in future 5G) will be used in the long-distance sector. The C-ROADS initiative, in which 18 EU member states are working together on the subject of C-ITS, is endeavouring not only to harmonise and further develop C-ITS throughout Europe, but also to define the necessary interfaces and data formats for this long-distance solution in the mobile radio sector. ASFINAG is a leading member of the C-ROADS initiative in these areas and will take both types of communication into account in the implementation.
The next generation of the communication technology could be initiated by companies such as Starlink or Kuiper if they are successful in deploying LEO constellations (Techbook, 2020). Starlink is a sub-company of Spacex and is trying to build an interconnected Internet network with thousands of satellites to deliver high-speed internet around the world (Sheetz, 2021). Starlink satellites are more than 60 times closer to Earth than conventional satellites, resulting in lower latency. Starlink is ideally suited for areas of the world where connectivity is normally a challenge (Starlink, n.d.). However, densely populated urban areas pose a problem (Holland, 2021). There are currently 2800 SpaceX satellites in space to build the global Internet service. Several thousand more satellites are to be added in the coming years. As “Golem” reports, there are to be 12000 satellites in the full expansion stage (finanzen.net, 2021; Statista 2022). While competitors like OneWeb or Amazon’s Project Kuiper are lagging behind (Holland, 2021). Starlink surpassed 400.000 subscribers in the mid 2022 (Sheetz, 2022) and is planning to reduce its costs by up to 50% later this year (futurezone.at, 2022). However, satellite Internet is intended for aircraft, ships, large trucks and motor homes. In 2021, Musk stated, that SpaceX is not yet planning to connect Tesla cars to Starlink, as their terminal is far too big (Musk, 2021). In 2022, the U.S. Federal Communications Commission (FCC) authorized SpaceX to provide Starlink satellite internet services in moving vehicles, a licence they applied for in 2021, while their main goal is to equip aircrafts, ships and RVs (Kundu, 2022).
Further, researchers warn of some consequences for astronomy due to this satellite system. The disadvantages include shorter effective working time of telescopes (due to satellites that may be in between during observations in space), higher potential for collision with research infrastructure, production of debris in orbit or an increased need for costly evasive manoeuvres of spaceships during space missions (Traxler & Rennert, 2020).
Relevant initiatives in Austria
DSRC modules are already used for truck toll billing in Austria. Around 152000 vehicles generated around 190 million euros in toll revenue in Austria via the Toll Collect OBU in 2018. The DSRC module works on a microwave basis and triggers a toll transaction when the vehicle passes through a toll collection station on Austrian motorways and motorways, which is then transmitted from the toll collection station to ASFINAG’s data centre for billing. The Toll Collect On-Board Unit, which is permanently installed in the truck, is characterised by high availability and stability. In Germany, the OBU continues to collect tolls via satellite.
Another current application of DSRC is the remote retrieval of tachograph data by control authorities. Since 15 June 2019, it has been mandatory to equip new trucks and buses over 3.5t MPTW (maximum permissible total weight) with a “smart tacho” that enables this (WKÖ, 2019). There are currently two C-ITS test environments: one around Vienna and one near Graz. The plan is to expand from 2020 onwards. The first area to be covered will be the Salzburg - Vienna corridor, the A2 around Graz and selected border areas.
At the European level, a community of road operators, vehicle and agricultural machinery manufacturers, cities, as well as industrial and telecom companies have come together to form an interest group called the “C-ITS Deployment Group”. Members of this group are committed to a coordinated C-ITS deployment in Europe, that is, C-ITS services should look the same across Europe and be understood by all vehicles (Erhart, 2019). About 293.000 ITS-capable vehicles are used on Austrian streets and its neighbouring countries, while 17.000 are registered as “intelligent” vehicles in Austria (Asfinag, 2022).
Impacts with respect to Sustainable Development Goals (SDGs)
| Impact level | Indicator | Impact direction | Goal description and number | Source |
|---|---|---|---|---|
| Systemic | Continuous development of communication technologies | + | Innovation & Infrastructure (9) | Techbook, 2020; Autotalks Ltd., n.d.; Salvo et al., 2017 |
| Systemic | New initiatives and interest groups are created | + | Partnership & collaborations (17) | Erhart, 2019 |
Open questions
1.What are the alternative solutions for joining DSRC and C-V2X so that they are compatible with one another?
References
- Annu, Kaushik, D., & Gupta, A. (2021). Ultra-secure transmissions for 5G-V2X communications. Materials Today: Proceedings. https://doi.org/10.1016/j.matpr.2020.12.130
- Autocrypt. (2021). AUTOCRYPT - DSRC vs. C-V2X: A Detailed Comparison of the 2 Types of V2X Technologies. https://www.autocrypt.io/blog-post/dsrc-vs-c-v2x-detailed-comparison
- Autotalks Ltd. (n.d.). C-V2X vs DSRC | Get Your Facts Straight on Cellular V2X, LTE-V and LTE-V2X Autotalks. Available at: https://www.auto-talks.com/technology/dsrc-vs-c-v2x-2/ [Accessed: 4 May 2021]
- Asfinag (2022, August 2). C-ITS oder wie Kommunikation zwischen Fahrzeug und Straße die Verkehrssicherheit erhöht. Asfinag Blog. Available at: https://blog.asfinag.at/technik-innovation/c-its-oder-wie-kommunikation-zwischen-fahrzeug-und-strasse-die-verkehrssicherheit-erhoeht/ [Accessed: 5 September 2022]
- Erhart, J. (2019, November 28). Vernetzte Autos, intelligenter Verkehr: Was C-ITS ist, was es kann und wem es nutzt.Available at: https://blog.asfinag.at/technik-innovation/c-its-vernetzte-autos-intelligenter-verkehr/ [Accessed: 4 May 2021]
- Fillenberg, S. (2017, December 18). Cellular V2X: Continental Successfully Conducts Field Trials in China. Continental Press Release. https://www.continental.com/en/press/press-releases/2017-12-18-cellular-v2x-116994
- finanzen.net. (2021, May 5). Internet aus dem All: Internetsparte von SpaceX: Starlink bald in Wohnmobilen, Schiffen und Flugzeugen? | Nachricht | finanzen.net. https://www.finanzen.net/nachricht/geld-karriere-lifestyle/internet-aus-dem-all-internetsparte-von-spacex-starlink-bald-in-wohnmobilen-schiffen-und-flugzeugen-9905140
- futurezone.at (2022, August 25). Starlink Satelliten-Internet wird um bis zu 50 Prozent billiger. Available at: https://futurezone.at/produkte/starlink-satelliten-internet-preis-50-prozent-billiger-elon-musk/402122739 [Accessed: 5 September 2022]
- Gettman, D. (2020, June 3). DSRC and C-V2X: The Future of Connected Vehicles | Kimley-Horn. https://www.kimley-horn.com/news-insights/dsrc-cv2x-comparison-future-connected-vehicles/
- Hajiyat, Z. R. M., Ismail, A., Sali, A., & Hamidon, M. N. (2021). Antenna in 6G wireless communication system: Specifications, challenges, and research directions. Optik, 231(February), 166415. https://doi.org/10.1016/j.ijleo.2021.166415
- Holland, M. (2021, May 5). Starlink: Schon 500.000 Vorbestellungen für Satelliten-Internet von SpaceX | heise online. https://www.heise.de/news/Starlink-Schon-500-000-Vorbestellungen-fuer-Satelliten-Internet-von-SpaceX-6036732.html
- IEEE. (2014). IEEE Guide for Wireless Access in Vehicular Environments (WAVE) - Architecture. IEEE Std 1609.0-2013, 1–78. https://doi.org/10.1109/IEEESTD.2014.6755433
- Kamruzzaman, M. M. (2022). Key Technologies, Applications and Trends of Internet of Things for Energy-Efficient 6G Wireless Communication in Smart Cities. Energies. 15, 5608. https://doi.org/10.3390/en15155608
- Kang, S., Han, S., Cho, S., Jang, D., Choi, H., & Choi, J.-W. (2016). High speed CAN transmission scheme supporting data rate of over 100 Mb/s. IEEE Communications Magazine, 54(6), 128–135. https://doi.org/10.1109/MCOM.2016.7498099
- Kundu, K. (2022). Starlink Internet in Cars, Boats & Planes just took a massive step forward. ScreenRant: Tech. Available at: https://screenrant.com/starlink-internet-coming-cars-boats-planes/ [Accessed: 5 September 2022]
- Mannoni, V., Berg, V., Sesia, S., & Perraud, E. (2019). A comparison of the V2X communication systems: ITS-G5 and C-V2X. IEEE Vehicular Technology Conference, 2019-April. https://doi.org/10.1109/VTCSpring.2019.8746562
- Musk, E. (2021, March 7). Elon Musk auf Twitter. https://twitter.com/elonmusk/status/1369051431903268865?ref_src=twsrc%5Etfw%7Ctwcamp%5Etweetembed%7Ctwterm%5E1369051431903268865%7Ctwgr%5E%7Ctwcon%5Es1
- Nitika, Rana, A., Kumar, V., & Awasthi, A. M. (2021). Effect of dopant concentration and annealing temperature on electric and magnetic properties of lanthanum substituted CoFe2O4 nanoparticles for potential use in 5G wireless communication systems. Ceramics International. https://doi.org/10.1016/j.ceramint.2021.04.077
- Pawan, M., Pal, M. B., Jain, P. K., Pampula, R. (2022). 6G Communication Networks: Introduction, Vision, Challenges, and Future Directions. Wireless Personal Communications. 125, 1097-1123. https://doi.org/10.1007/s11277-022-09590-5
- Rath, M., Pati, B., & Pattanayak, B. K. (2019). An Overview on Social Networking: Design, Issues, Emerging Trends, and Security. In Social Network Analytics (pp. 21–47). Elsevier. https://doi.org/10.1016/b978-0-12-815458-8.00002-5
- Salvo, P., Turcanu, I., Cuomo, F., Baiocchi, A., & Rubin, I. (2017). Heterogeneous cellular and DSRC networking for Floating Car Data collection in urban areas. Vehicular Communications, 8, 21–34. https://doi.org/10.1016/j.vehcom.2016.11.004
- Sattiraju, R., Wang, D., Weinand, A., & Schotten, H. D. (2020). Link level performance comparison of C-V2X and ITS-G5 for vehicular channel models. ArXiv, March.
- Sheetz, M. (2022, May 25). SpaceX’s Starlink satellite internet surpasses 400.000 subscribers globally. CNBC. Available at: https://www.cnbc.com/2022/05/25/spacexs-starlink-surpasses-400000-subscribers-globally.html [Accessed: 5 September 2022]
- Starlink. (n.d.). Starlink. Available at: https://www.starlink.com/ [Accessed: 6 May 2021]
- Statista (2022, August 29). Anzahl der Starlink Satelliten vom Raumfahrtunternehmen SpaceX im All im Zeitraum von August 2021 bis August 2022.
- Techbook. (2020, November 16). LTE, 4G und 5G: Die Unterschiede zwischen den Mobilfunkstandards.Available at: https://www.techbook.de/mobile/lte-4g-unterschied-mobil-smartphone [Accessed: 4 May 2021]
- Traxler, T., & Rennert, D. (2020, February 17). Starlink: Elon Musks Satellitenflotte in der Kritik - Raum - derStandard.at › Wissenschaft.Available at: https://www.derstandard.at/story/2000114681438/starlink-elon-musks-satellitenflotte-in-der-kritik [Accessed: 4 May 2021]
- WKÖ. (2019). Ausrüstungspflicht von neuen lkw und omnibussen mit einem „smart tacho“ ab 15. Juni 2019. Available at: https://www.google.com/url?sa=t&rct=j&q=&esrc=s&source=web&cd=&ved=2ahUKEwiyka_Xs7XwAhXytYsKHTq_AJ0QFjADegQIBBAD&url=https%3A%2F%2Fwww.wko.at%2Fbranchen%2Ftransport-verkehr%2Fausruestungspflicht-smart-tacho.pdf&usg=AOvVaw12-xLPvw33KN9gvYKy51tn [Accessed: 4 May 2021]
- Zhao, X., Jing, S., Hui, F., Liu, R., & Khattak, A. J. (2019). DSRC-based rear-end collision warning system – An error-component safety distance model and field test. Transportation Research Part C: Emerging Technologies, 107, 92–104. https://doi.org/10.1016/j.trc.2019.08.002
12.2 Big data lifecycle
Updated: 19th September 2022
Definition
“Big Data refers to large data sets that include heterogeneous formats: structured, unstructured and semi-structured data. Big Data has a complex nature that require powerful technologies and advanced algorithms. So the traditional static Business Intelligence tools can no longer be efficient in the case of Big Data applications” (Oussous et al., 2018). It is typically characterized by 3Vs (volume, velocity and variety) as described in Big Data Tools topic. In transport context the major sources of Big Data are:
- Drivers’ assistance systems and instrumented vehicles which constantly monitor the vehicle surroundings and driving behaviour
Yuan et al. (2015) claims that connected vehicles could produce even 30 GB of data per day. - Traveller information systems
- Roadway operations and management such as variable speed limits and dynamic signage system
- Traffic data
For example, real-time traffic information and monitoring which can produce structured and unstructured data, such as JPG, JSON, GPS, PDF, image, video, and social media posts (Kemp et al., 2015) - Emergency and incident management
The literature summarised in Neilson et al. (2019) shows the following use of Big Data in transport context:
| Big Data systems used | Purposes of Big Data analysis | Types of data collected | Current opportunities and challenges |
|---|---|---|---|
| ITS, Hadoop, MapReduce, batch and stream data processing, NoSQL | urban planning, collision and near miss analysis, traffic congestion, safety, optimization | Speed, location, video, image, traffic intensity, social media, crowdsourcing, machine learning, historical, real-time, predictive, visual, video/image analytics | Data collection, quality, storage, processing, privacy, security, connected and autonomous vehicle |
Further, an important part of Big Data is its life cycle, also called the information life cycle which is defined as the period of time that the data exists in the system. This life cycle encompasses all the stages that the data goes through, from first capture onward (Talend.com, 2021). Current literature proposes different models depending on the nature of the data and specific field. Nonetheless, they display some similarities and the majority of phases are shared by most data cycle models. For instance, according to Arras & Souissi (2018) the key phases of Big Data Lifecycle are:
- Planning: A detailed description of how data will be used, managed and made accessible throughout their life cycle
- Management: Includes all the operational phases that directly manipulate the data
- Collection: It consists of receiving the raw data of different types and making the conversions and modifications necessary to organize them. Cleaning of data received in real-time saves calculation time and memory space. Data quality must be carried out at this level because it makes it possible to optimize the data processing circuit overall
- Integration: The purpose of this phase is to provide a coherent pattern of data from multiple independent, distributed and heterogeneous sources of information so as to facilitate users accessing and querying such data as if they were accessing only one data source
- Filtering: Consists in restricting the large data flow to remove irrelevant data or errors
- Enrichment: Data enrichment involves making structural or hierarchical changes to received data. It allows adding information on collected data to improve their quality
- Analysis: In this phase, the data is exploited and analysed to draw conclusions and interpretations of decision-making
- Access: This phase is focused on the communication/interaction with the data consumer
- Visualisation: It consists of displaying the results of the analysis in a concise way so that decision-makers can easily understand these results and make informed decisions
- Storage: Concerns all the other phases of the cycle and makes it possible to store the data throughout its life cycle in order to have a continuous traceability of data in each phase of the cycle
- Destruction: In this phase data is discarded when it is successfully used and will become useless and without added value
- Archiving: Consists of an implementation of data security and confidentiality
Further, Djahel et al., (2014) proposed big data life cycle with respect to traffic management systems (TMS) as visualised in Figure 12.2.
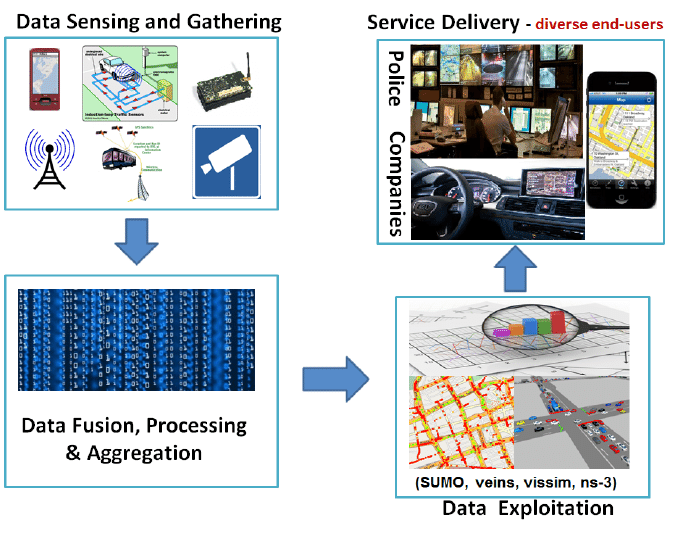
Figure 12.2: Big Data lifecycle in smart transportation (Djahel et al., 2014)
In the first phase Data Sensing and Gathering (DSG) the traffic data is monitored and collected, providing information about traffic volumes, incidents, occupancy or speed. Gathered data later feeds into the second phase Data Fusion, Processing and Aggregation where the relevant information is extracted from raw data. Next, in the third phase Data Exploitation the processed data is used to compute optimal routes, provide forcasts and obtain traffic statistics. Lastly, in the Service Delivery phase, the TMS shares the knowledge with the end users such as drivers, authorities or passengers through the variety of devices such as smart phones or vehicles’ on-board units.
Key stakeholders
- Affected: Passengers, Drivers, ITS focused companies
- Responsible: National Governments, Technology companies, ITS focused companies, Transport operators, Transport software developers
Current state of art in research
As mentioned above, literature offers different models of Big Data life cycle, beyond the Smart Data Lifecycle (DLC) model proposed by Arras & Souissi (2018). For example, according to Alshboul et al. (2015) the life cycle of Big Data encompasses four phases:
- Data collection
Data from different sources comes with different formats: structured, semi-structured, and unstructured. - Data storage
The collected data is stored and prepared for being used in the next phase. As the collected data may contain of sensitive information, it is essential to take sufficient precautions (e.g. permutation, anonimisation) during data storing. - Data analytics
Data is analysed to generate useful knowledge. In this phase, data mining methods such as clustering, classification, and association rule mining are used. - Knowledge creation
The results of the analyses are used by the decision makers.
While Demchenko et al. (2014) proposes Big Data Lifecycle Management (BDLM) model that consists of six stages:
- Data source
- Data collection
- Data cleaning (filtering, classification)
- Data analytics
- Data visualisations
- Data analytics application
A recent case study in Malaysia on IoT and Big Data Analytics in Transport Systems show cases the efficient and safe port environment, predictive maintenance and remote management, boundary-less software platform and connected ecosystem (Hussein et al., 2022).
Current state of art in practice
The typical management tools, techniques and software used to handle data are Google BigTable, Simple DB, Not Only SQL (NoSQL), Data Stream Management System (DSMS), MemcacheDB and Voldemort. However, new applications with higher capabilities are continuously developed to match Big Data requirements (Chen et al., 2014). For example, Hadoop is specifically designed to manage Big Data at different stages of its life cycle. It is an open source software framework that allows for the processing of large data sets across clusters of computers using simple programming models such as Google MapReduce (Khan et al., 2014). Hadoop can process extremely large volumes of data with varying structures (or no structure at all). It is typically applied to large amounts of data, enabling to handle data that was previously difficult to manage and analyse.
In terms of real-life examples, big data together with the Internet of Things (IoT) are used by Data Mill North’s national public transport access nodes (NaPTAN) in the UK to provide real-time transport information to passengers. For instance, train operators have been already using Big Data to offer information on live seat availability (Rayner, 2017).
In Austria, a current project in the mobility sector, dealing with big data, studies real-time data analytics, for which technologies based on high-performance computing (HPC) and big data solutions are used (Köhler, 2014).
Impacts with respect to Sustainable Development Goals (SDGs)
| Impact level | Indicator | Impact direction | Goal description and number | Source |
|---|---|---|---|---|
| Systemic | Increased safety of drivers and public transport passengers | + | Health & Wellbeing (3) | Rayner, 2017 |
| Systemic | Increased energy consumption | - | Environmental sustainability (7,12-13,15) | Lovell, 2018 |
| Systemic | Potential for more reliable and transparent partnership along the supply chain | + | Partnership & collaborations (17) | Robins, 2021 |
Open questions
- How to reduced potential for cyber-attacks and how the security methods can be improved?
- How can the problem of seeing data as a threat, in German speaking countries, be alleviated?
References
- Alshboul, Y., Nepali, R. K., & Wang, Y. (2015, August). Big Data LifeCycle: Threats and Security Model. In AMCIS.
- Chen, M., Mao, S., & Liu, Y. (2014). Big data: A survey. Mobile networks and applications, 19(2), 171-209.
- Demchenko, Y., De Laat, C., & Membrey, P. (2014, May). Defining architecture components of the Big Data Ecosystem. In 2014 International conference on collaboration technologies and systems (CTS) (pp. 104-112). IEEE.
- Djahel, S., Doolan, R., Muntean, G. M., & Murphy, J. (2014). A communications-oriented perspective on traffic management systems for smart cities: Challenges and innovative approaches. IEEE Communications Surveys & Tutorials, 17(1), 125-151.
- El Arass, M., & Souissi, N. (2018, October). Data lifecycle: From big data to smartdata. In 2018 IEEE 5th international congress on information science and technology (CiSt) (pp. 80-87). IEEE.
- Hussein, W. N., Kamarudin, L. M., Al-Hashimi, H., Zakaria, A., Ahmad, R. B., Zahri, N. A. H. B. (2022). The Prospect of Internet of Things and Big Data Analytics in Transport System. Journal of Physics: Conferene Series. 1018 012013. DOI: 10.1088/1742-6596/1018/1/012013
- Kemp, G., Vargas-Solar, G., Da Silva, C. F., & Ghodous, P. (2015, May). Aggregating and managing big realtime data in the cloud-application to intelligent transport for smart cities. In Proceedings of the 1st international conference on vehicle technology and intelligent transport systems (pp. 107-112).
- Khan, N., Yaqoob, I., Hashem, I. A. T., Inayat, Z., Mahmoud Ali, W. K., Alam, M., … & Gani, A. (2014). Big data: survey, technologies, opportunities, and challenges. The scientific world journal, 2014.
- Köhler, M., Meir-Huber, M. (2014). #Big Data in #Austria: Österreichische Potenzial und Best Practice für Big Data. Available at: file:///C:/Users/Administrator1/Downloads/big_data_in_austria.pdf [Accessed: 8 September 2022]
- Neilson, A., Daniel, B., & Tjandra, S. (2019). Systematic review of the literature on big data in the transportation domain: Concepts and applications. Big Data Research, 17, 35-44.
- Oussous, A., Benjelloun, F. Z., Lahcen, A. A., & Belfkih, S. (2018). Big Data technologies: A survey. Journal of King Saud University-Computer and Information Sciences, 30(4), 431-448. Rayner, T. (2017). Deriving Transport Benefits from Big Data and the Internet of Things in Smart Cities. Available at: https://www.womblebonddickinson.com/uk/insights/articles-and-briefings/deriving-transport-benefits-big-data-and-internet-things-smart [Accessed: 12 August 2021]
- Robins, C. (2021). WHY BIG DATA IS SO IMPORTANT TO THE TRANSPORTATION INDUSTRY Available at: https://www.robinsconsulting.com/why-big-data-is-so-important/ [Accessed: 12 August 2021]
- Talend.com (2021). Data Lifecycle Management (Definition and Framework). Available at: https://www.talend.com/resources/data-lifecycle-management/ [Accessed: 12 August 2021].
- Yuan, W., Deng, P., Taleb, T., Wan, J., & Bi, C. (2015). An unlicensed taxi identification model based on big data analysis. IEEE Transactions on Intelligent Transportation Systems, 17(6), 1703-1713.
12.3 Big data tools for mapping and forecasting travel behaviour
Updated: 19th September 2022
Definition
(Real Time) Traffic mapping
Traffic mapping is accomplished on the one hand with traffic sensors and on the other hand with smartphone data. State transport departments have started installing solar-powered traffic sensors on major roads across the country to record the current traffic situation in order to collect planning statistics, improve accident response times and increase traffic flow.
The data is collected using different types of traffic sensors. In recent years, three above-ground types have become popular: radar, active infrared and laser radar. Radar sensor technology has been around since World War II, when it helped the military track enemy ships in the air and at sea. Today’s technology allows each of these devices to monitor multiple lanes of traffic simultaneously (Machay, n.d.).
Google Maps is a major player in the field of navigation and traffic mapping. Until March 2012, there was no traffic feature - they simply focused on getting people from point A to point B. There was a feature before that showed how much traffic would slow a driver down, but there was no live data. Back then, only historical data was used to show how long the same route would take “in heavy traffic” (NCTA, 2013).
Then, on one hand, an agreement was reached with the traffic authorities to share the data generated by the sensors, and on the other hand, smartphone data could be used for real-time data. The data from the traffic authorities’ traffic sensors enabled Google to expand its traffic services, while the traffic authorities were able to pay part of the costs for the sensors. By working with various traffic authorities, Google received up-to-date information about congestion on motorways and major roads but was hardly able to monitor traffic on smaller rural roads and in residential areas. Current traffic data is collected mainly via GPS-enabled mobile phones running the Google Maps application. This continuously transmits the location and speed of each user to Google in real time. Using a technique known as “crowdsourcing”, Google combines the information provided by thousands of active mobile phones to determine how fast traffic is moving in a given location (Machay, n.d.). Regarding privacy, Google claims that users can decide whether or not to share their travel data with Google in their phone’s settings. The company points out that it tries to protect the information (Google itself doesn’t even know what data comes from which car, and it cuts off the first and last minutes of each trip to further obscure it). If users opt in, they help providing a helpful service - users get more realistic estimates of how long their journey will take and are better prepared for traffic. Mike Dobson (president of Telemapics) envisions a future scenario in which Google could suggest reroutes to 5 % of users to either ease traffic congestion or reduce the probability of delays occurring in the first place. Zhan Guo, a transportation policy professor at New York University, says it will be difficult to give advice on how to reroute traffic because drivers who travel a route daily know best what will take the longest. If there are few other ways to get from A to B, it’s pointless to suggest alternatives, because everyone will rush to clog up another road. An algorithm that diverts just the right amount of traffic is probably still a few years away, he says (NCTA, 2013).
Due to the increasing prevalence of mobile phones with built-in location and motion sensors in the population, extensive and dynamic data can be collected. Mobile phone data enables unprecedented population and geographic area coverage (Wang et al., 2018). The disadvantages of these systems are that radar sensors cannot detect broken-down vehicles because they cannot detect objects that are not moving. Active infrared and laser radar sensors do not work properly in dense fog or blowing snow. And crowdsourcing accuracy can be compromised if not enough mobile phones provide data for a given area (Machay, n.d.).
Traffic forecasting
In order to forecast traffic demand, information about the past, the state of the transport system and its external system are considered. Traffic forecasting methods can be divided into different types according to mathematical methods and calculation procedures, such as qualitative and quantitative, linear and nonlinear, dynamic and static, aggregated and disaggregated (Zhao et al., 2018).
Since the 1950s, the “four-stage model” has dominated travel demand forecasting methods. Since the 1970s, activity-based forecasting methods have attracted more attention.
Trip-based forecasting methods
Trip-based travel demand forecasting methods usually subdivide the unit of travel forecast in terms of an “aggregate” (traffic zone) and focus on the population and land use of the traffic zone. These methods generally consider spatial coordination at the city level, but ignore the actual travel needs and feelings of individual residents. Therefore, due to the low flexibility and low refinement level of the prediction results, these methods can easily lead to problems with uneven traffic distribution (Qin et al., 2013).
There are several travel-based forecasting methods. Zhao et al. (2018) lists 5 basic ones with advantages and limitations:
- Gray System Theory (GST)
In this system, some information is known and some information is unknown. It is almost impossible to use for short term forecasting based on conventional survey data. - Kalman filtering (KF)
It can estimate the state of the dynamic system from a set of incomplete and noisy measurements. - Chaos Theory (CT)
This focuses on the ordered structure and regularity of seemingly random phenomena in dynamical systems. However, a large amount of traffic monitoring data is required as training or decision samples. Due to data acquisition, input, transmission, and storage, these methods require lengthy preprocessing of the data and have limited real-time capabilities. - Artificial Neural Network (ANN)
A mathematical model that mimics the structure and function of biological neural networks. This also requires large amounts of traffic monitoring data and lengthy preprocessing of the data. - Support Vector Machine (SVM)
A machine learning method.
Activity-based forecasting methods
Activity-based forecasting methods are a type of disaggregated forecasting methods that focus on the reasons for individuals’ travel and the “activity-travel” model, using individuals as the research subjects. These methods also study the causal relationship between activities and travel. Examples include the multi-agent system (MAS) model and the multinomial logit (MNL) model. Activity-based forecasting requires a large amount of individual sample data (Zhao et al., 2018). Due to limited data processing capacity, they are primarily used for mode split and rarely used for traffic generation and distribution forecasting (P. Wang et al., 2013).
Big Data
Big Data refers to data that, at a certain stage of development, can no longer be collected, stored, analysed, or processed using traditional database software tools (Manyika et al., 2011). There are some characteristics and features of Big Data that are referred to as the Vs of Big Data Management (Al Nuaimi et al., 2015). According to Fan & Bifet (2013), these include the 3 main Vs (1, 2 and 3) and two other Vs:
- Volume: refers to the size of data created from all sources.
- Velocity: refers to the speed at which data is created, stored, analysed and processed.
- Variety: refers to the different types of data that are generated. It is common today for most data to be unstructured and not easily categorised or tabulated.
- Variability: refers to the fact that the structure and meaning of the data is constantly changing, especially in the case of data derived from, for example, natural language analysis.
- Value: refers to the potential advantage that Big Data can provide to a company based on good collection, management and analysis of Big Data.
Others mention some more Vs of Big Data, covering some more aspects. For example, volatility, which refers to the retention policy of structured data from different sources. Validity refers to the correctness, accuracy and validation of the data. Veracity refers to the accuracy and truthfulness of the data collected and the meaningfulness of the results generated from the data for specific problems (Al Nuaimi et al., 2015).
Other unique characteristics compared to traditional data analysis methods are: (1) the data source is extended from the sample data to the whole data; (2) the data of a single domain is extended to the cross-domain data; (3) the Big Data analysis mainly explores the relationships between the data (Zhao et al., 2018).
Due to the advancement of various technologies, the volume, variety and availability of data has increased rapidly. By 2003, humanity had generated five exabytes (5 × 10⁶ terabytes) of data (Sagiroglu & Sinanc, 2013). The same amount of data was generated in just two days in 2012 (McAfee et al., 2012).
In the past, road safety research studies have mostly used manually collected data (e.g. data from handwritten police accident reports) together with estimated static traffic volumes. Installations of detectors, sensors, a rapid spread of ITS and the advent of CAV led to an increase in the amount of data on people, vehicles, roads and environments (Lian et al., 2020).
Historically, travel behaviour research data has largely been derived from travel surveys, and such data is costly to collect and outdated. This has limited data collection and inhibited progress in travel behaviour research (Liu et al., 2016). In the era of Big Data, various new data sources can be used to supplement or replace traditional survey data to support travel behaviour research. Some examples are data from smart card records, GPS-based taxi trajectory data and roadside sensor data, with mobile phone data being the most common and promising type (Yue et al., 2014). There are two main sources of mobile phone data currently used for travel behaviour research (Z. Wang et al., 2018):
- Mobile phone network data This involves using RF (radio frequency) signals to determine the location of mobile phones. These RF signals include mobile network signals, GPS, AGPS, WiFi and Bluetooth.
- Smartphone sensor data
Built-in sensors (accelerometers, magnetic sensors and compasses) are used to monitor the movement status of mobile phones.
Different types of data are collected by different organisations using different techniques for different purposes. In general, attempts to use mobile phone data in travel behaviour research in 2021 are in an early stage, and ongoing research has many limitations in terms of research topics, applied methods and results. However, there are also some revolutionary achievements that have been made to date.
The role of Big Data in traffic management and travel characteristics analysis has been widely discussed by researchers. However, there are several problems in traffic demand forecasting. Mainly due to the randomness of travel and the openness of the transportation system, both the travel behaviour of people and the traffic flows of the road system are subject to uncertainty. The evolution of Big Data is described with a small sample phase (1980s), through the large sample phase (1990s), to the current Big Data phase. Initially, there was relatively little traffic data due to limited data collection methods, and traffic demand forecasting models were designed to achieve better predictive performance with small samples. In the 1990s, traffic monitoring technology improved significantly, and the volume of traffic data grew rapidly. However, since the beginning of the 21st century, some research results have shown that the prediction accuracy is not significantly improved by increasing the number of samples. The accuracy of individual sample information is cited as the real key.
Through Big Data, traffic data have evolved from the original static single data set to a multi-source, multi-state, and multi-structure data set that combines both static and dynamic data. The data collection of the whole network includes attribute data of individual people or vehicles in addition to traffic data (traffic flow, fleet length, vehicle type, travel direction, travel time, instantaneous speed, travel speed). Collaboration between the traffic information centre and a mobile operator have become the main form of Big Data application. Data collection for motor vehicles is done via GPS on electronic license plates. In the era of Big Data, unstructured data (web click streams, documents, social networks, the Internet of Things, phone call logs, videos, photos) will also be used in transportation to study people’s travel behaviour (Zhao et al., 2018).
New trends in travel demand forecasting mainly concern the following eight aspects (Zhao et al., 2018):
- The number of forecast samples has increased significantly
- The amount of information and the accuracy of each sample has improved significantly.
- Disaggregated methods are being increasingly researched and applied, and more attention is being paid to individual travellers
- Aggregated and disaggregated methods are being integrated
- Combining models has become a development trend
- There are more methods and resources for micro-level travel forecasting
- Random traffic data is avoided and non-traffic data (instead of traffic data) is used for forecasting
- Cost constraints on travel demand forecasting are likely to be removed, making data collection easier
Due to the limitations of aggregated methods and the scaling of traffic zones, traditional travel demand forecasting methods are often not accurate enough for forecasting demand for non-motorized vehicles such as walking and bicycling. With the implementation of urban strategies such as “green traffic”, “slow traffic”, and “liveable city”, there is an objective need to improve the accuracy of traffic forecasts for pedestrian and bicycle traffic. Big Data methods may offer a way to do this (Zhao et al., 2018).
Key stakeholders
- Affected: Social media and/or Smartphone users, Car drivers
- Responsible: Social media and/or Smartphone users, Car drivers, Researchers, Traffic monitoring authorities, Transport Agencies
Current state of art in research
Al Nuaimi et al. (2015) names 3 benefits of Big Data analytics that can be applied in smart cities:
- Efficient use of resources
- Better quality of life
- A higher degree of transparency and openness
These benefits require a high level of complexity and commitment in terms of applications, resources and people involved. The opportunities to achieve these benefits exist, however, they require investment in more technology, better development efforts and effective use of Big Data. Policies must also be established to ensure accuracy, high quality, high security, privacy and control of data. Further, data documentation standards must be used to explain the content and use of data sets (Bertot & Choi, 2013).
Big Data applications have the potential to serve many areas in a smart city. Improving healthcare by enhancing preventive services, diagnostic and treatment tools, health record management and patient care. Transport systems can benefit greatly from Big Data in optimising routes and schedules, meeting different demands and being more environmentally friendly (Al Nuaimi et al., 2015).
Some research looks at the collection of Big Data through mobile phones in terms of travel behaviour. Choujaa & Dulay (2009) gave an overview of human activity recognition based on mobile phone data. Deutsch et al. (2012) investigated the collection of different types of data by various sensors built into smartphones and analysed sensor frequency, activity inferences and battery consumption. Calabrese et al. (2014) summarised the use of network-based mobile data for urban sensing. Steenbruggen et al. (2015) summarised existing spatial studies based on mobile data and explored the possibility of achieving smart city goals with mobile data. Yue et al. (2014) explored how different types of trajectory data, including mobile phone data, are used for travel behaviour studies. Liu et al. (2016) addressed the problem of Big Data collection, processing and analysis in spatial information science and related fields. Wang et al. (2018) summarised existing studies on travel behaviour using mobile phone data.
Lian et al. (2020) listed models and applications of Big Data in ITS and CAV safety research. They examined some articles using Big Data to study road safety. Most of the reviewed studies focused on detecting or predicting accidents, the second important research topic identified was the discovery of factors contributing to accidents, the identification of accident blackspots and the analysis of driving behaviour.
Birkin & Malleson (2011) extracted four months of Twitter data from 9223 users and consequently combined with GIS technology through intelligent modelling to identify the basic behaviours of urban living, education, work, entertainment, shopping, and travel patterns. Combined with spatial GIS data (vehicles, driver data and population, land use, remote sensing, road network, road planning and the network of transportation facilities), a predictive basis has been captured. However, there are significant ethical issues surrounding the use of this data in such methods, as users of social media platforms are not fully aware of the implications. Subjects do not give their consent to the research as usual and the data collected is not strictly protected by data protection laws. As a minimum, user names should always be hidden and maps should be used with a resolution that makes it impossible to identify individual houses.
Sevtsuk et al. (2021) researched pedestrian route choice preferences from walking trajectories. The data from smartphone applications in San Francisco were used to study various street attributes that are known to affect pedestrian route choice while using novel techniques to gather alternative paths. Urban big data (UBD) is currently generated at an unprecedented scale in relation to volume, variety and speed producing new possibilities for applying UBD to travel behaviour in research (Wang et al., 2020). Current state of the art in research shows, that big data is used in a variety of areas to understand and map travel behaviour and thereby offer researchers and practitioners opportunities to capture urban phenomena and deepen the knowledge of individual travel behaviour (Svetsuk et al., 2021; Wang et al., 2020).
Current state of art in practice
In many cases, the uses of Big Data are probably not accessible. However, some examples have been found.
In 2005, Beijing used taxi data to map the operation of the city’s entire road network. By 2014, the number of taxis had increased to 30,000. With the proliferation of electronic number plates, Big Data will enable the collection, processing and analysis of all driving behaviour. The Beijing Traffic Information Centre now also uses GPS data from mobile phones provided by China Mobile to collect traffic information and analyse the characteristics of residents’ travel distribution (Lian et al., 2020).
Some companies specialise in traffic data. Google offers some data for use. For example, the Google Maps application programming interface (API) which is by far the most widely used mapping APIs with more than 1 billion extensions worldwide. Google Maps has evolved into a whole range of different APIs. In total, there are 14 different APIs (Damgaard, 2017). These are for example:
- Google Maps Places API gives access to Google’s global database of over 100 million businesses and points of interest).
- Google Maps Geocoding API can automatically determine an address based on a pin and conversely convert addresses into geographic coordinates
- Google Maps Geolocation API provides a location and accuracy radius based on cell tower and WiFi node information
- Google Directions API provides directions for a range of locations with different mobility options (car, train, bike, walking)
- Google Map Distance Matrix API provides information about distance and travel time for several destinations taking into account the current traffic situation
Lau (2020) the Product Manager of Google Maps stated that over 1 billion kilometres are travelled every day using Google Maps in more than 220 countries and territories around the world. When navigating with Google Maps, aggregated location data can be used to understand traffic conditions on roads around the world. While this information helps estimate current traffic levels, it does not take into account what traffic will be in 10, 20 or even 50 minutes. To predict what traffic will look like in the near future, Google Maps analyses historical traffic patterns for roads over time. The database of historical traffic patterns is combined with current traffic conditions and machine learning is used to make predictions based on both data sets.
AI will be used to further improve the accuracy of the traffic forecasts. The predictions already have accuracy of over 97% but the percentage of inaccurate ETAs is expected to decrease even further through a machine learning architecture known as Graph Neural Networks - with significant improvements in places such as Berlin, Jakarta, São Paulo, Sydney, Tokyo and Washington D.C. This technique allows Google Maps to better predict whether drivers will be affected by a traffic jam that may not have even started yet.
The mobility changes caused by the outbreak of the COVID 19 pandemic have led to a drop in global traffic of up to 50%. Subsequently, parts of the world have gradually reopened, while restrictions remain in place in other parts. To respond to these sudden changes, Google has updated their models to become more flexible (historical traffic patterns from the past two to four weeks are prioritised and patterns from the time before are deprioritised). However, predicting traffic and determining routes is incredibly complex - and work continues on tools and technologies to avoid congestion.
Finally, it is important to look at the energy consumption associated with Big Data, where the it is estimated to consume about 200 terawatt hours (TWh) annually. This translates into half of the electricity used for transport worldwide, and around 1 per cent of global electricity demand and poses an enormous ecological challenge. While computers offer a net energy consumption reduction at system level (through reduced transportation, better manufacturing techniques etc.) increased computer use leads to a growth in data centres and a trend towards higher density and higher processing power equipment, causing a rise in localised energy consumption and emissions. Consequently, Information and Communication Technology (ICT) is one of the largest sectors for the consumption of energy (Lovell, 2018).
Impacts with respect to Sustainable Development Goals (SDGs)
| Impact level | Indicator | Impact direction | Goal description and number | Source |
|---|---|---|---|---|
| Individual | Increase in vehicle safety | + | Health & Wellbeing (3) | Lian et al., 2020 |
| Individual | More efficient fuel consumption | + | Environmental sustainability (7,12-13,15) | Al Nuaimi et al., 2015 |
| Systemic | Reduced travel time | + | Health & Wellbeing (3) | Lau, 2020 |
| Systemic | Increased energy consumption | - | Environmental sustainability (7,12-13,15) | Lovell, 2018 |
References
- Al Nuaimi, E., Al Neyadi, H., Mohamed, N., & Al-Jaroodi, J. (2015). Applications of big data to smart cities. Journal of Internet Services and Applications, 6(1), 25. https://doi.org/10.1186/s13174-015-0041-5
- Anagnostopoulos, I., Zeadally, S., & Exposito, E. (2016). Handling big data: research challenges and future directions. Journal of Supercomputing, 72(4), 1494–1516. https://doi.org/10.1007/s11227-016-1677-z
- Bertot, J. C., & Choi, H. (2013). Big Data and E-Government: Issues, Policies, and Recommendations. Proceedings of the 14th Annual International Conference on Digital Government Research, 1–10. https://doi.org/10.1145/2479724.2479730
- Birkin, M., & Malleson, N. (2011). Microscopic Simulations of Complex Flows (Issue December). http://eprints.ncrm.ac.uk/2051/1/complex_city_paper[1].pdf
- Calabrese, F., Ferrari, L., & Blondel, V. D. (2014). Urban Sensing Using Mobile Phone Network Data: A Survey of Research. ACM Comput. Surv., 47(2). https://doi.org/10.1145/2655691
- Choujaa, D., & Dulay, N. (2009). Activity recognition from mobile phone data: State of the art, prospects and open problems. Imperial College London, 1–32.
- Damgaard, M. (2017, September 7). Google Maps APIs - How to choose the right API key type? | MapsPeople. https://www.mapspeople.com/blog/mapsindoors/google-maps-api-description/?utm_term=google maps api&utm_campaign=Google+Maps+API+(Fokusmarkeder)&utm_source=adwords&utm_medium=ppc&hsa_acc=1756747029&hsa_cam=9568964808&hsa_grp=100103134522&hsa_ad=477511645844&hsa_src=g&hsa_tgt=aud-1074199825348:kwd-336979256761&hsa_kw=google maps api&hsa_mt=p&hsa_net=adwords&hsa_ver=3&gclid=CjwKCAjwx8iIBhBwEiwA2quaq37WdAzuUTzEEynIONxqGOL7V_62jAgOvV_H2B6kB9kJtjva-90xABoCtacQAvD_BwE
- Deutsch, K., Mckenzie, G., Janowicz, K., Li, W., Hu, Y., & Goulias, K. (2012). Examining the use of smartphones for travel behavior data collection. International Conference on Travel Behaviour Research, July, 1–10.
- Fan, W., & Bifet, A. (2013). Mining Big Data: Current Status, and Forecast to the Future. SIGKDD Explor. Newsl., 14(2), 1–5. https://doi.org/10.1145/2481244.2481246
- Kramers, A., Höjer, M., Lövehagen, N., & Wangel, J. (2014). Smart sustainable cities - Exploring ICT solutions for reduced energy use in cities. Environmental Modelling and Software, 56, 52–62. https://doi.org/10.1016/j.envsoft.2013.12.019
- Lau, J. (2020, September 3). Google Maps 101: How AI helps predict traffic and determine routes. https://blog.google/products/maps/google-maps-101-how-ai-helps-predict-traffic-and-determine-routes/
- Lian, Y., Zhang, G., Lee, J., & Huang, H. (2020). Review on big data applications in safety research of intelligent transportation systems and connected/automated vehicles. Accident Analysis and Prevention, 146(September), 105711. https://doi.org/10.1016/j.aap.2020.105711
- Liu, J., Li, J., Li, W., & Wu, J. (2016). Rethinking big data: A review on the data quality and usage issues. In ISPRS Journal of Photogrammetry and Remote Sensing (Vol. 115, pp. 134–142). Elsevier B.V. https://doi.org/10.1016/j.isprsjprs.2015.11.006
- Lovell, A. (2018). Big data: A big energy challenge? Available at: https://www.energycouncil.com.au/analysis/big-data-a-big-energy-challenge/ [Accessed: 11 August 2021]
- Machay, J. (n.d.). How Does Google Detect Traffic Congestion? Available at: https://smallbusiness.chron.com/google-detect-traffic-congestion-49523.html [Accessed: 10 August 2021]
- Manyika, J., Institute, M. G., Chui, M., Brown, B., Bughin, J., Dobbs, R., Roxburgh, C., & Hung Byers, A. (2011). Big Data: The next frontier for innovation, competition, and Productivity. McKinsey Global Institute. Available at: http://hdl.handle.net/2324/3144682 [Accessed: 4 August 2021]
- McAfee, A., Brynjolfsson, E., Davenport, T. H., Patil, D. J., & Barton, D. (2012). Huge data: The the executives transformation. Harvard Bus Rev, 90(10), 60 68.
- NCTA. (2013, July 3). How Google Tracks Traffic | NCTA — The Internet & Television Association. Available at: https://www.ncta.com/whats-new/how-google-tracks-traffic [Accessed: 4 May 2021]
- Qin, X., Zhen, F., Xiong, L. F., & Zhu, S. J. (2013). Methods in urban temporal and spatial behavior research in the big data era. Progress in Geography, 32(9), 1352–1361.
- Sagiroglu, S., & Sinanc, D. (2013). Big data: A review. 2013 International Conference on Collaboration Technologies and Systems (CTS), 42–47. https://doi.org/10.1109/CTS.2013.6567202
- Steenbruggen, J., Tranos, E., & Nijkamp, P. (2015). Data from mobile phone operators: A tool for smarter cities? Telecommunications Policy, 39(3–4), 335–346. https://doi.org/10.1016/j.telpol.2014.04.001
- Sevtsuk, A., Basu, R., Li, X., Kalvo, R. (2021). A big data approach to understanding pedestrian route choice preferences: Evidence from San Francisco. Travel Behaviour and Society. 25, 41-51. https://doi.org/10.1016/j.tbs.2021.05.010
- Wang, P., Huang, Z.-R., & Gong, H. (2013). Transportation engineering in the big data era. Dianzi Keji Daxue Xuebao/Journal of the University of Electronic Science and Technology of China, 42(6), 806–816. https://doi.org/10.3969/j.issn.1001-0548.2013.06.002
- Wang, Z., He, S. Y., & Leung, Y. (2018). Applying mobile phone data to travel behaviour research: A literature review. Travel Behaviour and Society, 11, 141–155. https://doi.org/10.1016/j.tbs.2017.02.005
- Wang, C., Hess, D. B. (2020). Role of Urban Big Data in Travel Behaviour Research. Transportation Research Borad. 2675 (4). https://doi.org/10.1177/0361198120975029
- Yue, Y., Lan, T., Yeh, A. G. O., & Li, Q. Q. (2014). Zooming into individuals to understand the collective: A review of trajectory-based travel behaviour studies. Travel Behaviour and Society, 1(2), 69–78. https://doi.org/10.1016/j.tbs.2013.12.002
- Zhao, Y., Zhang, H., An, L., & Liu, Q. (2018). Improving the approaches of traffic demand forecasting in the big data era. Cities, 82, 19–26. https://doi.org/10.1016/j.cities.2018.04.015